The EU aquaculture industry is a politically prioritized industry as shown in the EU’s Farm to Fork Strategy. However, while a lot of attention has been paid to the economic importance and environmental impact from the aquaculture sector, there has been less focus on the social dimension. This article presents a review of the employment in the sector presenting demographic information on gender, age, education and nationality.
The European Union (EU) aquaculture sector provides jobs for 69,000 persons in 15,000 enterprises. This includes ten thousand owners and family members engaged in small family driven businesses contributing to the social dimension.
Employment is an important part of the social dimension of aquaculture sustainability, and the EU has strongly committed to the UN Sustainable Development Goals (SDGs) where social objectives are important.
This is captured in the strategic work of the EU as shown e.g. in the European Green Deal (European Commission, 2019). In this paper, social indicators for the aquaculture industry in the EU are presented for the first time.
This provides a first overview of the social status of the marine industries within the EU and its Member States and can be used to identify important clusters that are employed within the industry.
Method
The demographic data cover information about numbers of persons employed by gender, age, education level and nationality. Data collected for the analysis cover 18 countries – Bulgaria, Croatia, Germany, Greece, United Kingdom, Denmark, Finland, France, Ireland, Italy, Latvia, Malta, Netherlands, Portugal, Romania, Slovenia, Spain and Sweden.
Results by member state
Gender
In Figure 1 the overall gender distribution of the employed in the EU aquaculture sector is shown. The sector is dominated by male employees covering 77%, while female employees cover 22% of the workforce. The gender distribution is shown for each country.
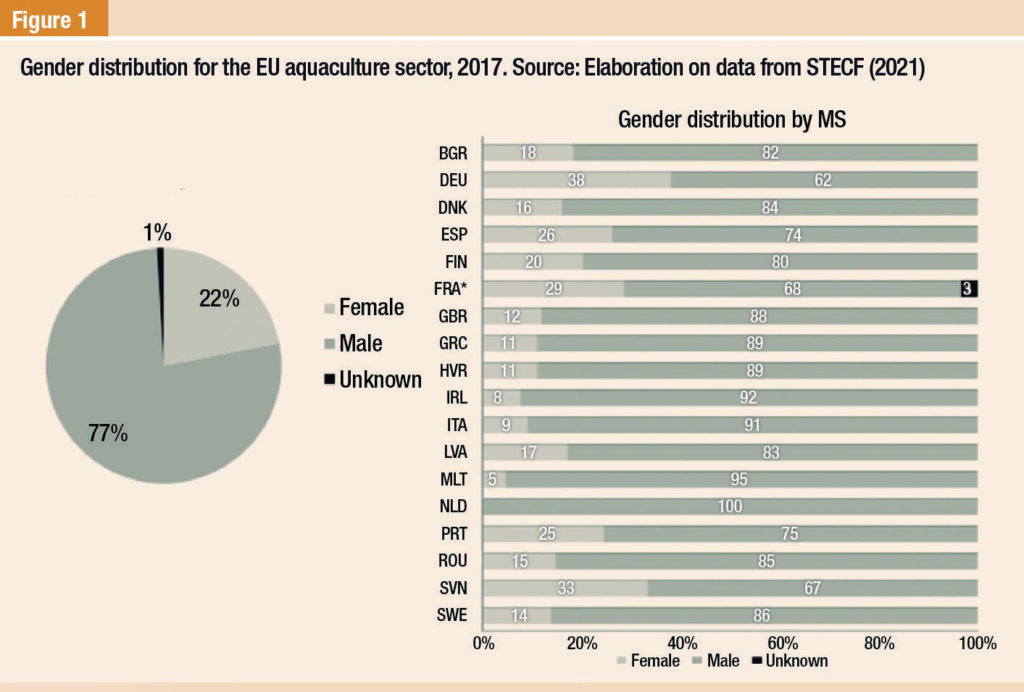
The percentage of female employees in the different countries ranged between 0% in the Netherlands and up to 38% in Germany. The Netherlands has a relatively small sector, which consists of highly advanced recirculation facilities, whereas the German sector covers sea based blue mussel farming and land based traditionally earth pond trout and carp farming.
Equally interesting is the social dynamics of the presence of cooperatives of women who raise bivalves (mainly mussels), a dynamic that characterizes the employed in central-northern Adriatic Regions.
Age
In Figure 2, the age class structure for the overall EU aquaculture sector is shown. The age class 40–64 covers the most years and is also the largest in terms of employees, covering 45% of the people employed. The second largest group is the age class 25–39 covering 28%.

The employees are distributed by age for each country. The percent-age of the age group 40–64 was highest in Slovenia (81%), Bulgaria (68%) and Finland (67%), whereas the age class 25–39 dominated the employment in Malta (51%), followed by Croatia (40%), and the UK (39%).
The highest percentage of employees over 65 years is found in Romania with 32%, followed by Portugal and Sweden covering 16% and 11%, respectively.
Education
In Figure 3, the education level for the EU is shown. Overall, 39% of the persons employed in the aquaculture sector reported a low level of education, followed by 35% with a medium level education. For 9% a higher-level education was reported, whereas 17% was reported as unknown.

The countries showing the largest percentage within the group of high-level education were Latvia (35%), Germany (26%), Romania (23%) and Sweden (23%). In contrast, Italy (73%), Spain (58%) and Portugal (47%) had the most people with a low-level education employed in the aquaculture sector.
Nationality
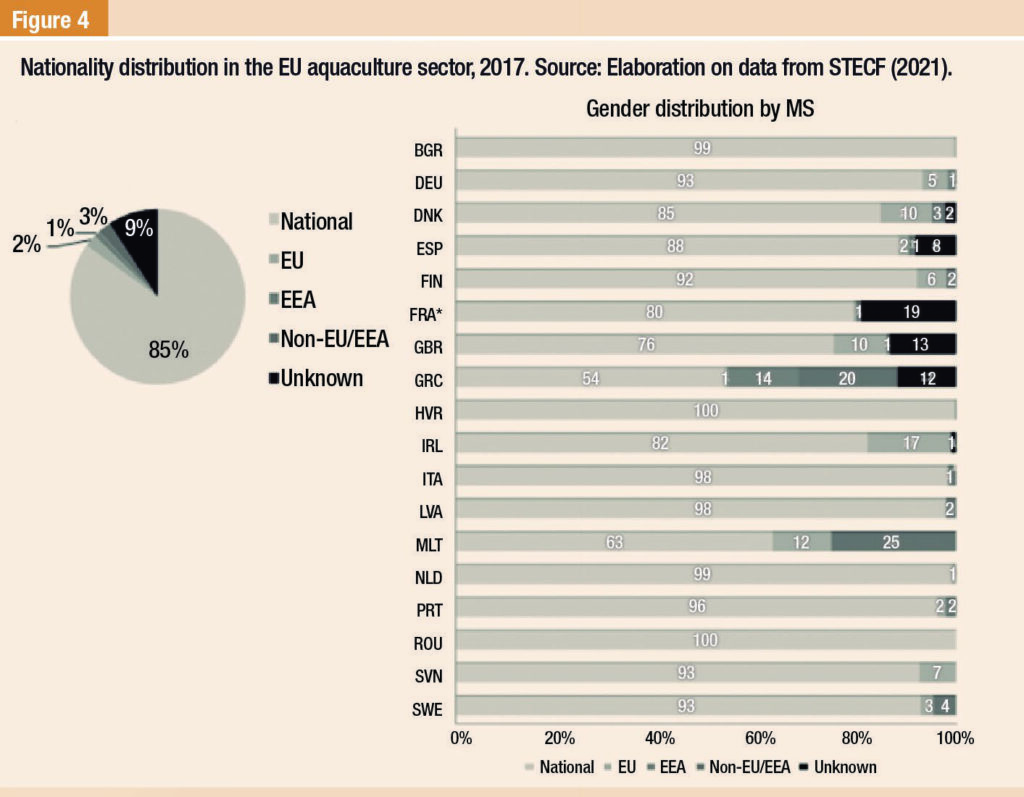
Figure 4 shows that the majority of the employees, making up 85%, were nationals of the country where the production took place. 2% originated from other EU countries and 3% were employees from non- EU/EEA countries. Also, it can be seen that in all the countries surveyed, nationals are the dominant source of employment.
Results by production sector and technology
Gender
The gender distribution is approximately equal for all sectors with about 20–25% female employees. The male dominance is consistent for all production technologies and sectors although differences occur. The technology with the highest share of females is the shellfish production technology on bottom having a share of 30% females.
The on bottom shellfish technology is the largest in terms of employees with approximately 21,000 employed persons where the majority (58%) are employed in France.
Age
The age category 40–64 years covers the largest interval (25 years) and is the category covering the largest share of the employees in the production sectors and for most production technologies as well.
The sectors show rather equal age distributions with a slightly younger workforce in the shellfish sector. 9% of the employees in the shellfish sector are below 25 years and 28% are between 25 and 39 years of age.
Notably, the freshwater segment has the highest share of employees over 65 years (11%). The technology with the highest share of young employees (15–39 years) are enclosures and pens followed by others.
Education level
From all the demographic variables collected for the EU aquaculture sector, education level is the one showing the highest fluctuations when looking at sectors and production technologies. Employees with a low educational level dominate both the marine and shellfish sectors, while freshwater production is dominated by employees with a medium level education (50%).
Nationality
Persons from their respective home nations dominate employment in all sectors and within all production technologies. Most technologies employ a small percentage from outside the country. An exception is the longline technology where 13% is from the EEA countries and cages where 16% is from non-EU/EEA countries.
The reason cages have a relatively large share of non-EU/EEA country employees is that a large part of the seabass and seabream industry is located in Greece and the tuna farming in Malta, which are also the countries with the highest share of non-EU/EEA country employees.
Discussion and conclusion
A structured collection on demographic indicators is an important tool for the EU to be able to plan, execute and evaluate the EU strategies towards SDG goals and further social development in the EU. The EU aquaculture industry is heterogeneous, containing multiple species and production technologies.
With many of these having different social settings, EU policies for developing the aquaculture sector might face different obstacles or have different impacts on society depending on which specific species or technology that is targeted.
For example, production of freshwater species in ponds has a low level of young employees indicating that policies aiming for increased production need to target issues with recruitment. Similar issues could be expected for aquaculture in ponds, but not for some of the other production technologies.
For example, in the Longline mussel production, close to 40%t of the staff is below 40 years, indicating a considerably younger workforce. The employees working with this technology are, on the other hand, poorly educated with almost 50% having a low education.
Thus, expanding aquaculture production using Longline technology is expected to provide employment opportunities for younger and less educated citizens compared to production in freshwater ponds.
The examples above provide insights about how the social data can be used for targeting specific objectives within EU aquaculture policies including support to the sector through the European Marine, Fisheries, and Aquaculture Fund.
By taking into consideration age, education, gender, etc. for different production technologies it is possible to overcome obstacles or take social considerations into account.
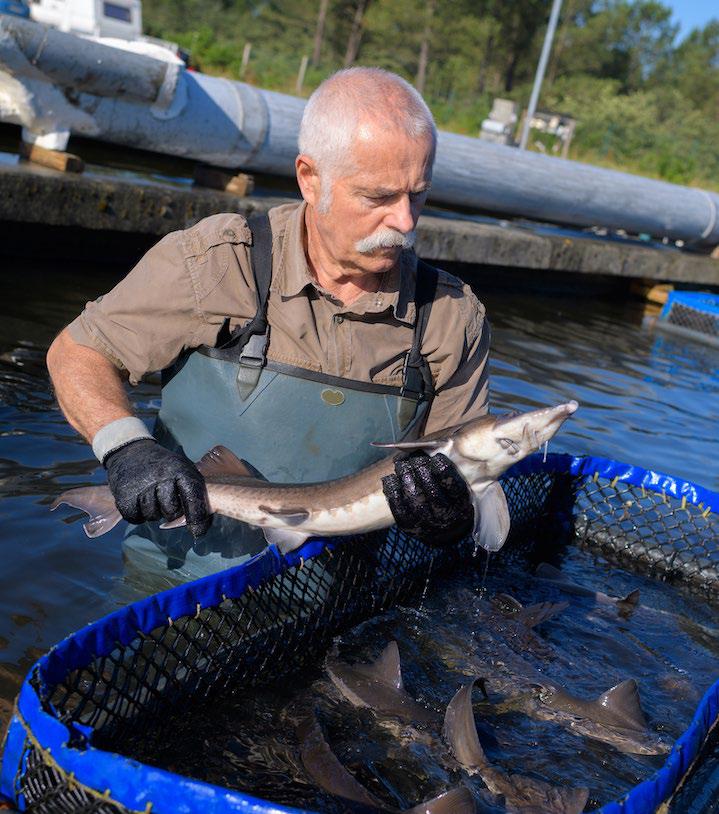
Considering the technical development within the EU aquaculture sector, more and more attention and effort has been put into the development of high performance production systems. These systems aim at producing high volumes with the lowest possible environmental impact generated, most often represented by larger scale closed or semi closed fresh water production systems (Nielsen et al., 2016).
The reason for this is that economies of scale exist in the aquaculture sector (Nielsen, 2011) and that aquaculture is competing with agriculture when it comes to emission of nutrients, such as, nitrogen and phosphorus.
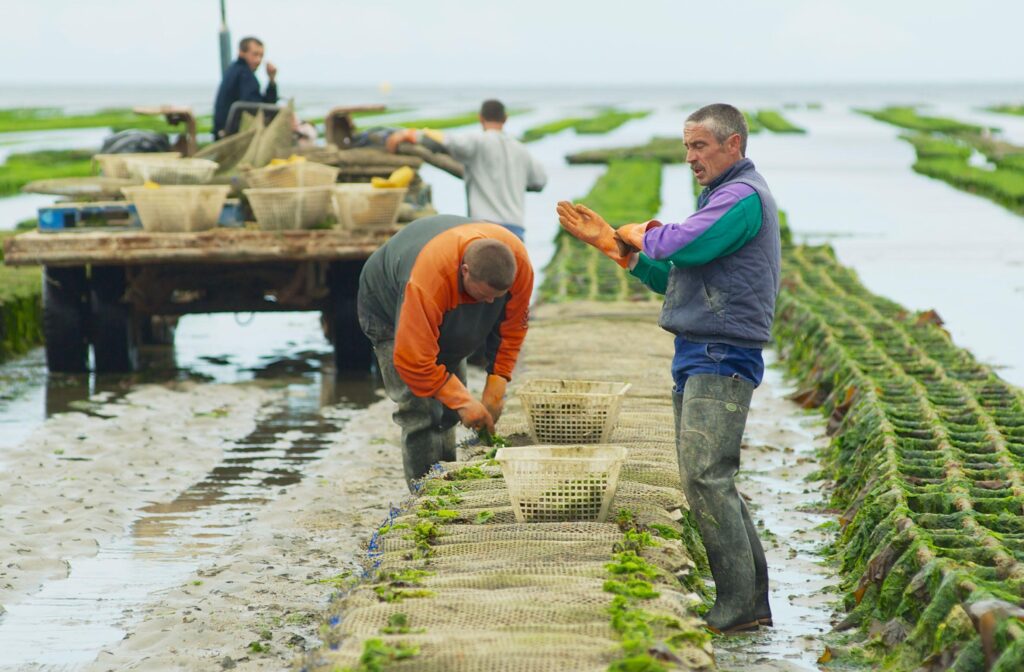
For the shellfish sector the situation is quite different as shellfish do not require feed and are extracting nutrients from the marine environment. This type of aquaculture is performed close to the coastline, it is quite labor intensive and does not require highly skilled labor.
An increased shellfish production is therefore more dependent on access to labor, space for production and avoiding disease. Investments in training of employees may help obtain greater professionalization that could help boost blue growth in aquaculture.
The importance of social indicators is not only a political topic but has also proven interesting from a biological standpoint, especially within fisheries- and ecosystem based management where the development of management strategies might be supported/opposed by local fishing communities depending on social factors (Waldo et al., 2020).
The report WGSOCIAL (a specific working group on social indicators) identified a list of important concepts to measure, such as well-being, livelihood, capabilities, knowledge, place, social dynamics, demographic and geographic characteristics, fairness, engagement, governance, etc. (ICES, 2021).
These metrics might be used for a comprehensive social evaluation of the seafood sector as a whole. The collection of demographic variables for fisheries, processing and now also aquaculture are important steps towards social science in the sector.
A more comprehensive collection of social data for the EU aquaculture sector covering all Member States would increase the insight that could be extracted from the data, especially concerning the freshwater sector where some countries did not report.
Furthermore, the reporting of “unknown” should be reduced to increase the validity of the analysis. An increasing focus and further collection and analysis of socio- demographic data could be used for strengthening the foundation for EU policies towards reaching SDG goals, such as gender equality and quality of education, in the future.
This is a summarized version developed by the editorial team of Aquaculture Magazine based on the review article titled “COLLECTING DEMOGRAPHIC DATA FOR THE EU AQUACULTURE SECTOR: WHAT CAN WE LEARN?)” developed by:
SIMONA NICHEVA- Executive Agency for Fisheries and Aquaculture, Bulgaria;
STAFFAN WALDO Swedish University of Agricultural Sciences;
RASMUS NIELSEN – University of Copenhagen;
TOBIAS LASNER Institute of Sea Fisheries, Bremerhaven;
JORDI GUILLEN – European Commission, Joint Research Centre;
EMMET JACKSON – Ireland’s Seafood Development Agency;
ARINA MOTOVA – Seafish, Edinburgh;
MARIA COZZOLINO – Fisheries and Aquaculture Economic Research, Italy;
AVDELAS LAMPRAKIS – Ministry of Environment and Energy, Athens;
KOLYO ZHELEV – Executive Agency for Fisheries and Aquaculture, Bulgaria.
The original article was published on MAYO, 2022, through AQUACULTURE.
The full version, including tables and figures, can be accessed online through this link: https://doi.org/10.1016/j.aquaculture.2022.738382.


