


* By Aquaculture Magazine Editorial Team
Mangrove forests provide critical ecosystem services, including serving as nursery habitats for fish, protecting coastlines from erosion, and supporting local livelihoods. They are also among the most efficient carbon sinks on Earth, storing large amounts of “blue carbon” in deep, organic-rich soils that can retain carbon for centuries. Globally, mangroves store between 3.7 and 20 petagrams (Pg) of carbon, with soils accounting for up 90% of total carbon stocks.
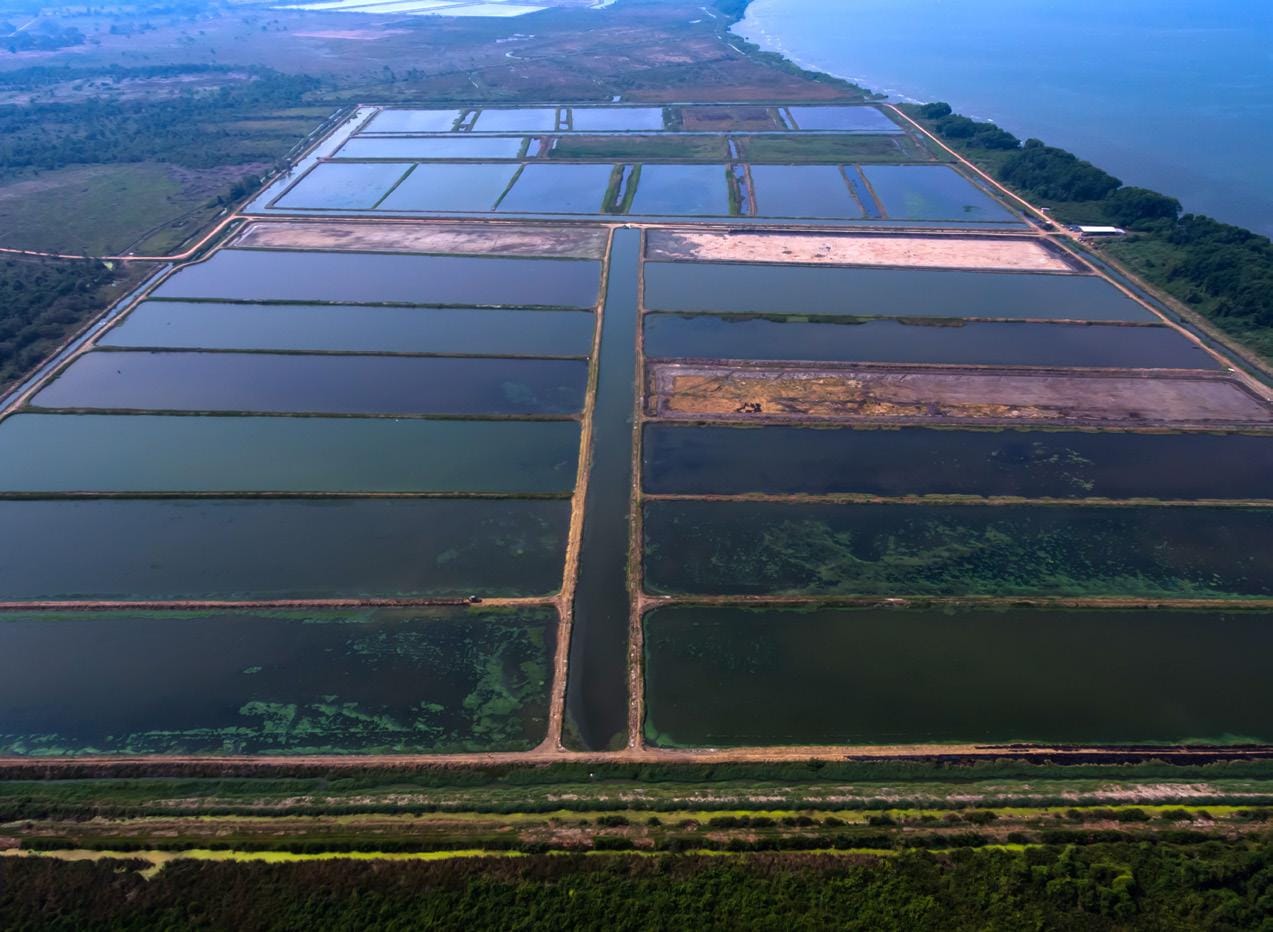
Despite their importance, mangroves are being lost at a rate of 1-2% annuals due to sea-level risen pollution and especially coastal development. Aquaculture, particularly shrimp farming, is a major driver, responsible for about 38% of mangrove deforestation. The conversion process involves clearing vegetation, excavating soil, and constructing pond systems, which significantly disrupts the ecosystem.
This transformation leads to substantial carbon emissions through both physical removal of carbon-rich soils and biogeochemical processes.
However, accurately estimating these emissions remains challenging due to variability in environmental conditions, species, and aquaculture practices. Existing assessment methods may underestimate total emissions by overlooking certain pathways or including regenerated systems.
Mangrove forests are highly efficient carbon sinks, storing ‘blue carbon’ in organic-rich soils for centuries. However, shrimp aquaculture drives 38% of global mangrove deforestation, disrupting these ecosystems through vegetation clearing and soil excavation, which triggers massive greenhouse gas emissions.
Given these uncertainties, more comprehensive research is needed to evaluate the full climate impact of mangrove conversion. Understand-ing both physical and biogeochemical carbon losses is essential for improving management strategies and integrating mangrove conservation into climate change mitigation efforts.
Materials and Methods
The study was conducted using soil and water samples from a mangrove system in Estero Bay, Florida, to simulate aquaculture conversion through controlled microcosms. Intact mangrove soils and modified soils representing shrimp pond construction were maintained under controlled temperature and light conditions for
2.5 years, covering drainage, operational and abandoned phases.
Hydrochemical parameters such as salinity, temperature, pH, nutrients, and carbon content were measured regularly. Soil carbon, bulk density, and greenhouse gas emissions were analyzed using standardized methods, including closed chamber techniques to estimate CO2-equivalent fluxes and global warming potential.
Additionally, a systematic review and meta-analysis were conducted to compare soil carbon across studies, while statistical analyses assessed differences between mangrove and aquaculture conditions and enabled broader extrapolation of results.
The conversion to aquaculture ponds leads to a significant reduction in soil carbon stocks, averaging 46.82%. Systematic reviews confirm that mangroves contain approximately 819.38 Mg C ha⁻¹, whereas operational aquaculture ponds drop to 435.77 Mg C ha⁻¹ due to physical and biogeochemical losses.
Results
Carbon losses and bulk density
During aquaculture construction, the removal of 1 m of soil resulted in an estimated loss of 422.1 ± 14.6 Mg C ha¹ (1,549.11 Mg CO₂e ha-1), with resampling indicating an actual loss of ~242.9 Mg C ha-1 (57.78%). In comparison, mangrove microcosms contained approximately 242.1 Mg C ha-1 within the top 0.5 m (Table 1).
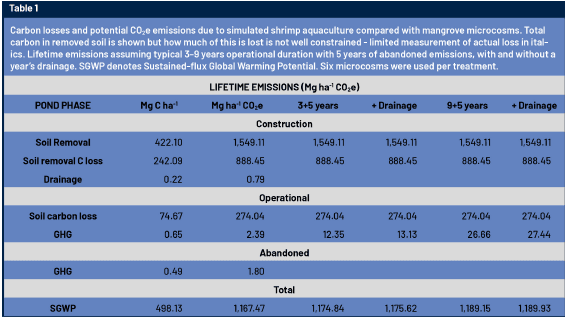
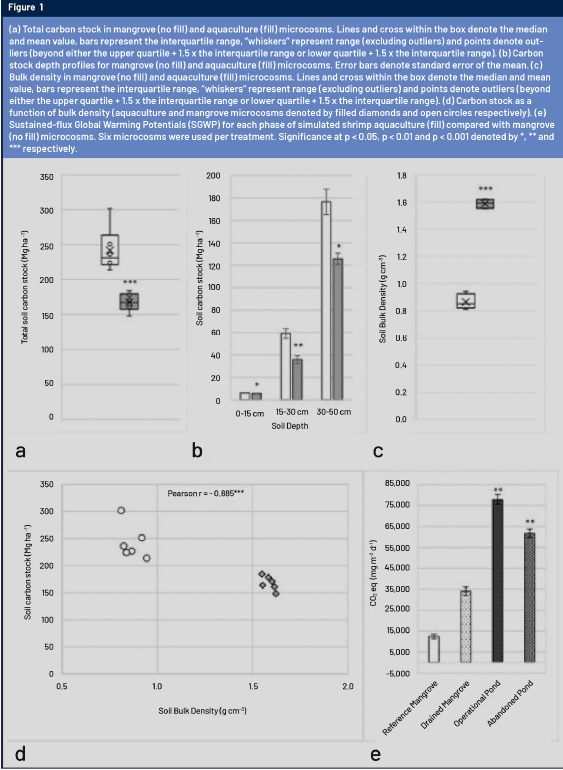
Comparisons between mangrove and operational aquaculture microcosms revealed a significant carbon loss of 30.1% ± 0.8% (74.67 Mg C ha-¹ or 274.04 Mg CO₂e ha-¹; p < 0.001; Figure 1a), observed across all soil depths (Figure 1b). Bulk density also decreased by 54.59% (Figure 1c; p < 0.001), with a strong negative correlation between bulk density and carbon stock (r = −0.885; p < 0.001; Figure 1d).
Potential CO₂e emissions
Under drainage conditions, sustained global warming potential (SGWP) increased by 34,075.38 mg m-² d-¹ (172.39%), with all greenhouse gases contributing moderately. This represents a difference of 21,565.39 mg m-² d-¹ or 0.79 Mg CO₂e ha-¹ yr-¹ compared to mangrove systems (Figure 1e).
The largest emissions occurred during the operational phase, with an increase of 65,343.26 mg m-² d-¹ (522%), equivalent to 2.39 Mg CO₂e ha-¹ yr-¹. Significant increases in CH₄ and N₂O effluxes were observed, while CO₂ uptake exceeded that of mangrove systems.
In the abandoned phase, after one year, emissions increased by 393.59% (49,238.68 mg m-² d-¹), corresponding to 1.80 Mg CO₂e ha-¹ yr-¹. CH₄ and N₂O contributed significantly, while CO₂ emissions remained lower than in mangrove systems.
Aquaculture construction involves removing topsoil layers, resulting in an estimated physical carbon loss of 422.1 Mg C ha⁻¹. This transformation significantly increases bulk density and degrades soil porosity, creating a strong negative correlation between soil compaction and total carbon retention.
Total lifetime emissions and extrapolation
Considering five years after abandonment, an additional 5.19 Mg CO₂e ha-¹ yr-¹ is generated. Assuming operational periods of 3–9 years, total SGWP ranges from 12.35 to 26.66 Mg CO₂e ha-¹, or up to 27.44 Mg CO₂e ha-¹ when including drainage.
Including biogeochemical soil carbon losses increases total emissions to 286.39 – 301.48 Mg CO₂e ha-¹. When construction-related soil loss is added, total emissions reach approximately 1,174.84 – 1,189.93 Mg CO₂e ha-¹ (Table 1). Biogeochemical emissions account for roughly 24–25% of total emissions.
Systematic review and meta-analysis
The meta-analysis showed a consistent and significant reduction in soil carbon due to aquaculture (effect size−1.63; p < 0.001). On average, man-groves contain 819.38 Mg C ha-¹, com-pared to 435.77 Mg C ha-¹ in aquaculture ponds, representing a reduction of 46.82% ± 8.70% (p < 0.001).
Carbon reductions were observed at all depths, with larger differences below 30 cm. At depths greater than 100 cm, mangroves contained 62.55% more carbon than aquaculture systems. In both systems, most carbon was stored below 100 cm depth.
Significant differences in bulk density were also found, with lower values in mangrove soils (p < 0.001) and a negative correlation with carbon stocks (rs = −0.490).
Estimates based on the Land Use Change Stock (LUCS) approach ranged from 1,390 to 3,799 Mg CO₂e ha-¹, with a mean soil carbon loss equivalent to 1,407.85 Mg CO₂e ha-¹. However, few studies account for all greenhouse gases or total SGWP, suggesting potential underestimation of emissions.
Sustained-flux Global Warming Potentials (SGWP) spike during the operational phase of shrimp farming, increasing by 522%. High organic matter inputs stimulate anaerobic degradation and methanogenesis, while nitrogen from fertilizers drives significant increases in nitrous oxide (N₂O)
Discussion
Effects of aquaculture on carbon loss pathways
Aquaculture conversion resulted in significant soil carbon loss, with 74.67 Mg C ha-1 lost during the operational phase compared to mangrove systems (Figure 1a). These losses are driven by biogeochemical processes such as root decomposition and anaerobic degradation stimulated by nutrient inputs. Construction activities further contribute through the removal of approximately 1 m of soil containing around 422.1 Mg C ha-1 (Table 1), with an estimated 57% lost through oxidation, leaching, and decomposition.
The systematic review (SR) confirms a strong and consistent reduction in soil carbon (effect size -1.63), suggesting that aquaculture conversion leads to substantial carbon loss regardless of environmental variability. Physical processes, particularly soil removal and compaction, are key drivers. Mangrove soils show higher carbon stocks, with losses averaging 43-46% after conversion.
Bulk density (rb) increased significantly in aquaculture systems (Figure 1c), indicating soil degradation and re-duced porosity. The inverse relationship between rb and carbon (Figure 1d) highlights the impact of compaction from construction activities.
Microcosm simulations reveal that biogeochemical pathways contribute approximately 25% to the total sustained-flux global warming potential (SGWP). These often-overlooked pathways, including root decomposition and nutrient-stimulated degradation, are essential for accurate life cycle assessments (LCA) in the aquaculture sector.
Additionally, hydrological changes such as dyke construction limit tidal flooding, reducing carbon inputs and contributing to long-term declines. These processes suggest that carbon losses may continue over time, potentially being underestimated.
Effects of aquaculture on potential CO2e emissions and SGWP
Drainage increased emissions by Mg CO2e ha-1yr-1 (Figure 1e; Table 1), con-sistent with enhanced decomposition under oxygen exposure. Methane (CH4) and nitrous oxide (N2O) emissions also increased, indicating peat degradation.
During the operational phase, emissions rose by 2.39 MgCO2 ha-1 yr-1 (Figure 1e), driven by high organic matter inputs from feed and fertilizers. Anaerobic sediment conditions promote methanogenesis, while nitrogen inputs stimulate nitrification and denitrification, increasing N2O emissions. Some systems may act as CO2 sinks when algal production exceeds emissions, although management practices such as aeration influence outcomes.
Even after abandonment, former aquaculture ponds exhibit legacy effects, with emissions remaining nearly 400% higher than intact mangrove systems. Long-term climate mitigation requires better management of abandoned systems and the prioritization of pond reuse to minimize further land-use changes
In the abandoned phase, emissions remained elevated at 1.80 Mg-CO2e ha-1 yr-1, indicating long-term legacy effects. Over five years. This adds 5.19 Mg CO₂e ha-1. Total emissions across the system life cycle range from 1,174.83 to 1,189.93 Mg CO2e ha-1 (Table 1), with biogeochemical processes contributing about 24–25%. While soil carbon loss dominates emissions, these pathways are often underestimated, emphasizing the need to include them in life cycle assessments.
Comparison of the microcosm model experiments and systematic review
Microcosm experiments effectively replicate field conditions, showing similar carbon loss patterns, depth profiles, and relationships between carbon and bulk density. Both top-down (microcosm) and bottom-up (SR) approaches produced compara-ble results up to 100 cm depth. Differences at greater depths likely reflect methodological uncertainties in field studies.
The hydrologically closed nature of ponds appears to drive consistent carbon loss patterns. However, mi-crocosms may underestimate deeper biogeochemical losses, while field studies may include additional vari-ability. Factors such as sediment type, hydrology, and nutrient pollution influence results.
Although microcosms did not include live shrimp processes, they captured major emission pathways. Additional sources, such as gut-de-rived N₂O and methane production, may further increase emissions. The LUCS method remains useful for large-scale estimates but may underestimate short-term emissions. A combined microcosm and SR approach is recommended for more accurate assessments.
Globally, soil carbon losses from mangrove-to-aquaculture conversion could represent up to 40% of all anthropogenic emissions related to mangrove loss. Conserving these blue carbon habitats is a critical strategy for meeting international climate targets and improving industry sustainability.
Exploration of the importance of mangrove aquaculture in climate mitigation
At a national scale, emissions from mangrove conversion appear mod-est, contributing around 0.01% of anthropogenic emissions. However, at a global scale, aquaculture-related soil carbon loss could account for 2.48–3.01 Pg CO₂e, representing up to 40% of anthropogenic emissions.
These findings highlight the importance of mangrove conservation in climate mitigation strategies. However, uncertainties remain due to variability in environmental conditions and methodological limitations. Current estimates may under-estimate total emissions by excluding biomass losses, deeper soil impacts, and downstream effects.
Overall, reducing mangrove de-forestation and improving aqua-culture practices are essential to minimize emissions and enhance sustainability.
Conclusion
Microcosm simulations indicate that biogeochemical pathways may contribute about 25% to total SGWP beyond LUCS estimates, although soil carbon loss during construction and operation remains the dominant source. Reusing ponds and extending operational periods could improve sustainability, while soil fate, drain-age effects, and abandoned system management require further study. Results align with systematic review findings showing consistent carbon loss across systems, though sediment type remains understudied. Global extrapolations suggest emissions of~3 Pg CO₂e, highlighting the critical role of mangroves in climate mitigation and the need for improved management and conservation strategies.
This is a summarized version developed by the editorial team of Aquaculture Magazine based on the review article titled “EFFECTS OF SHRIMP AQUACULTURE ON MANGROVE SOIL CARBON STOCKS AND SUSTAINED-FLUX GLOBAL WARMING POTENTIALS” developed by: Fenner, N. and Hayward, E. – Bangor University, Bovard, B. – Florida Gulf Coast University, Creer, S. and Dunn, C. Bangor University. The original article, including tables and figures, was published on MARCH, 2026 , through FRONTIERS IN ENVIRONMENTAL SCIENCE. The full version can be accessed online through this link: DOI 10.3389/fenvs.2026.1729512