


By Aquaculture Magazine Editorial Team
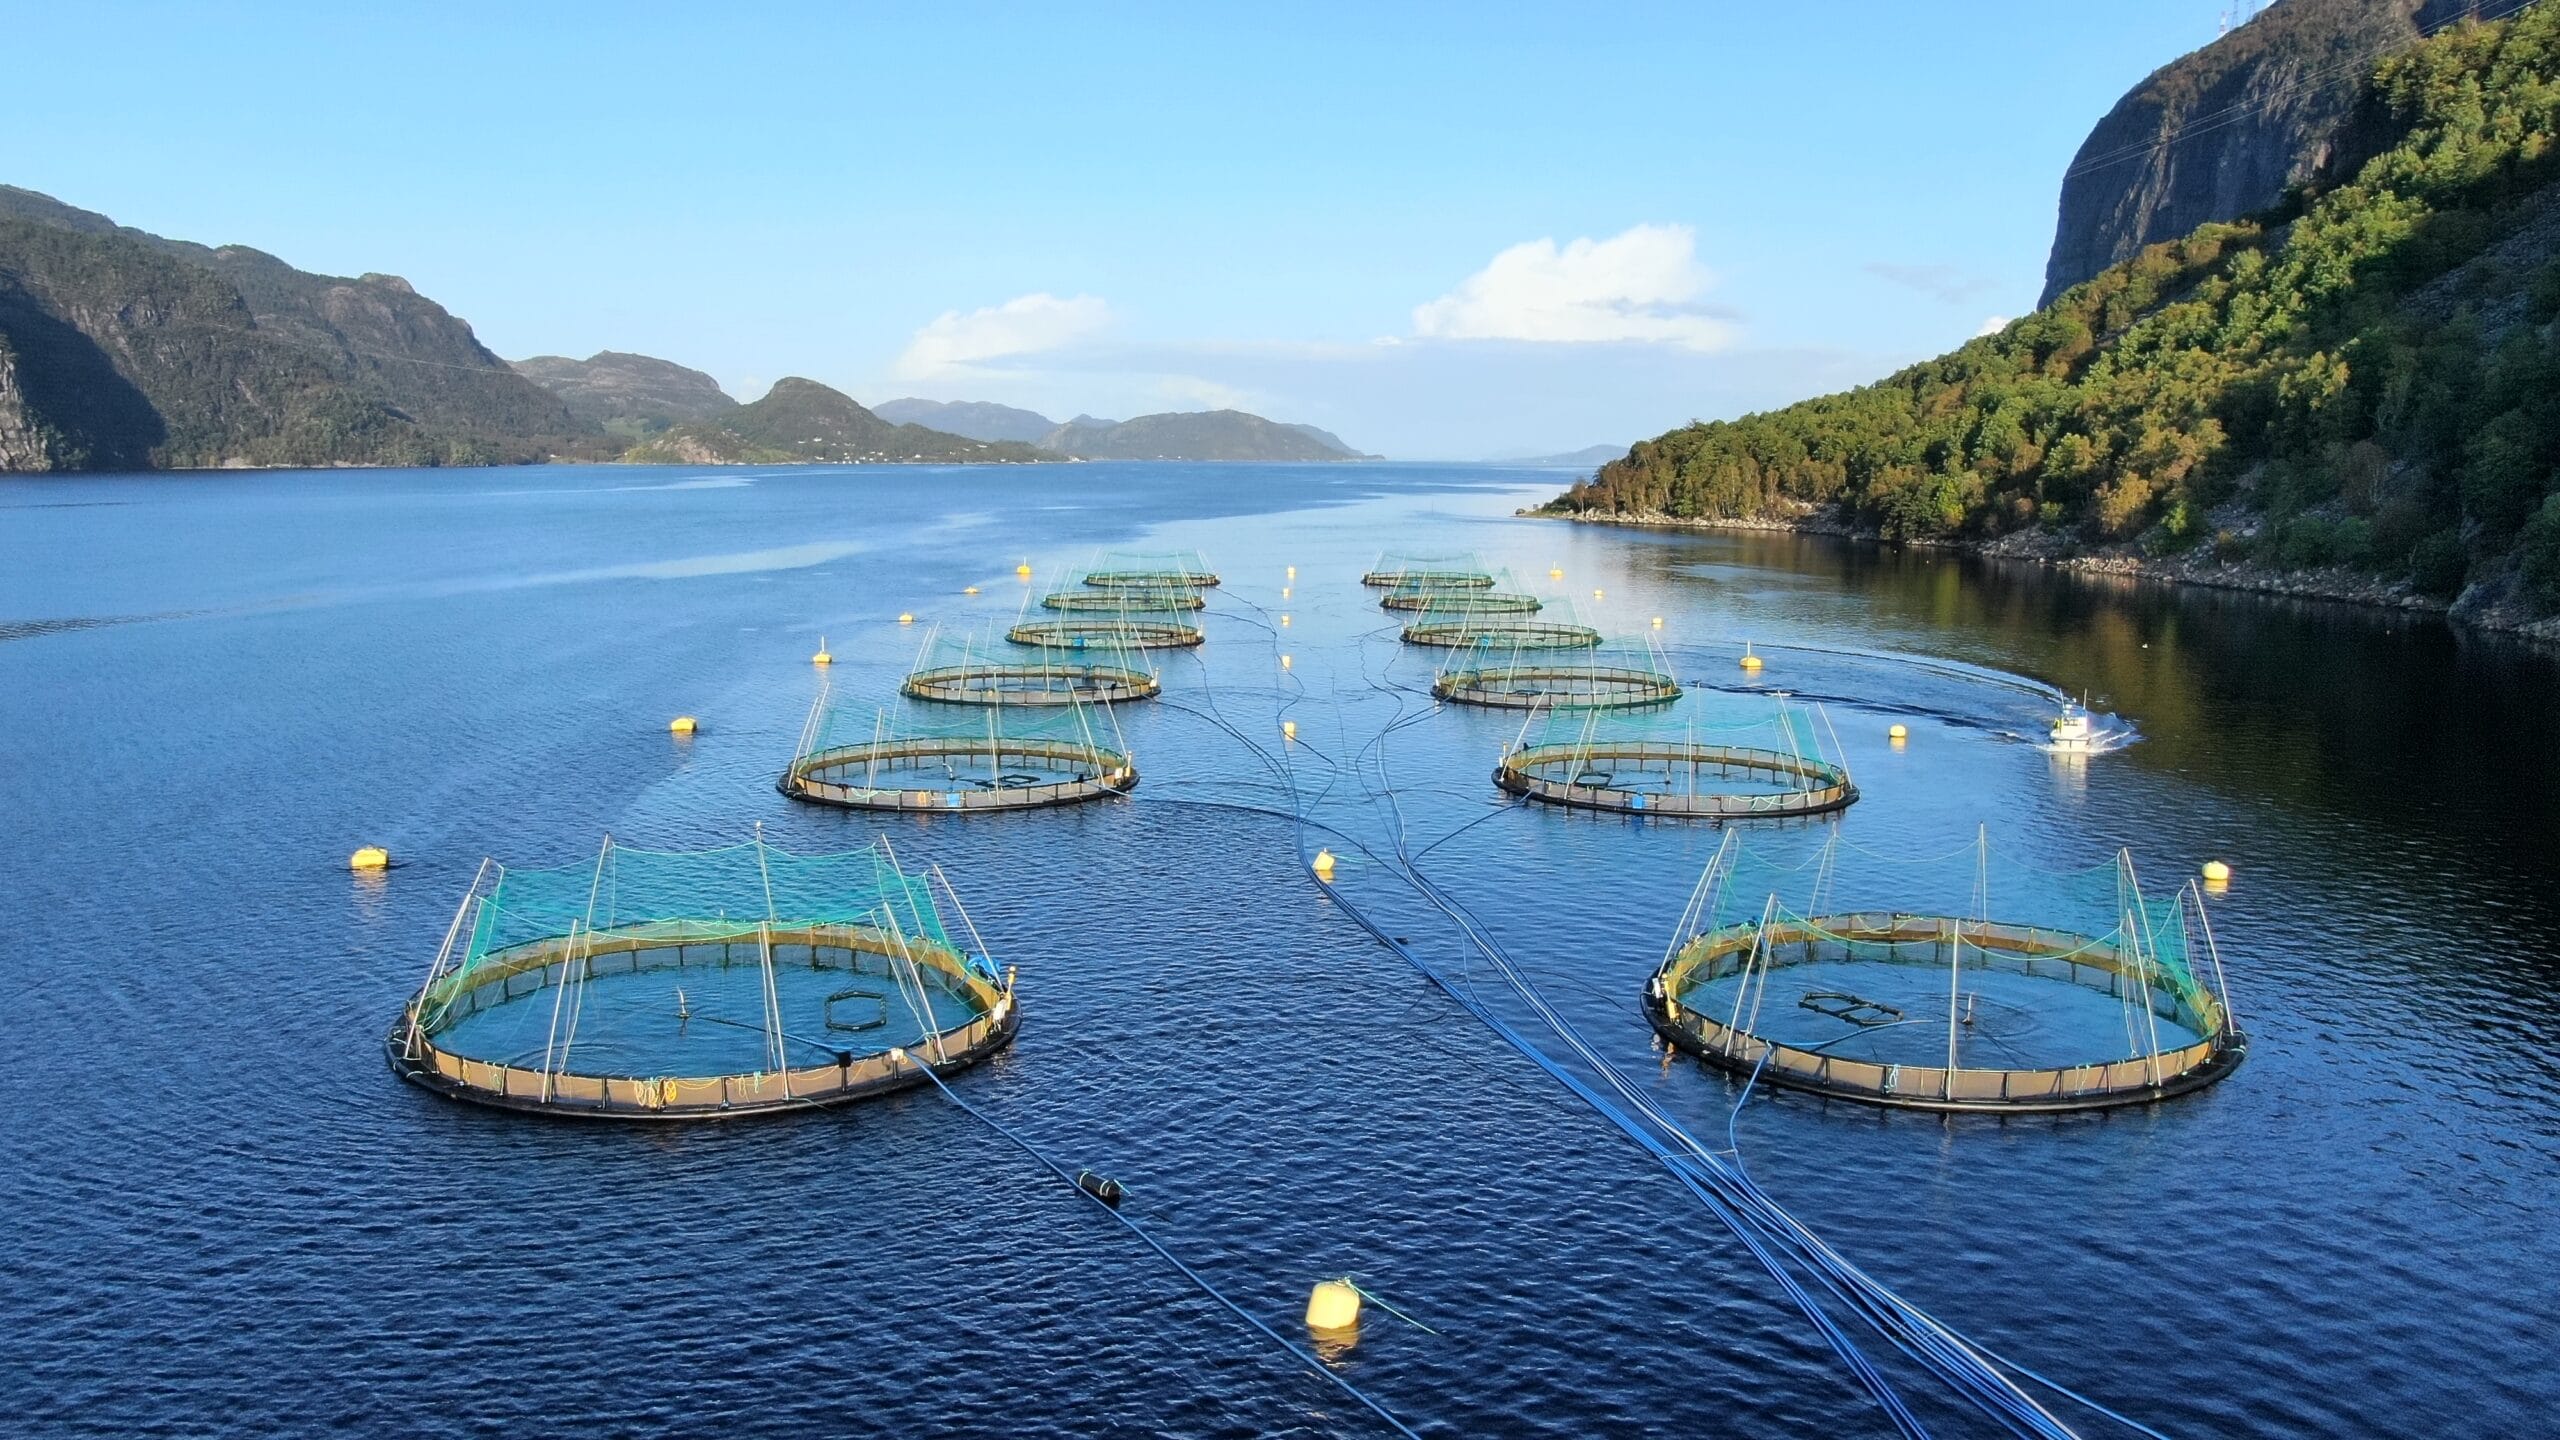
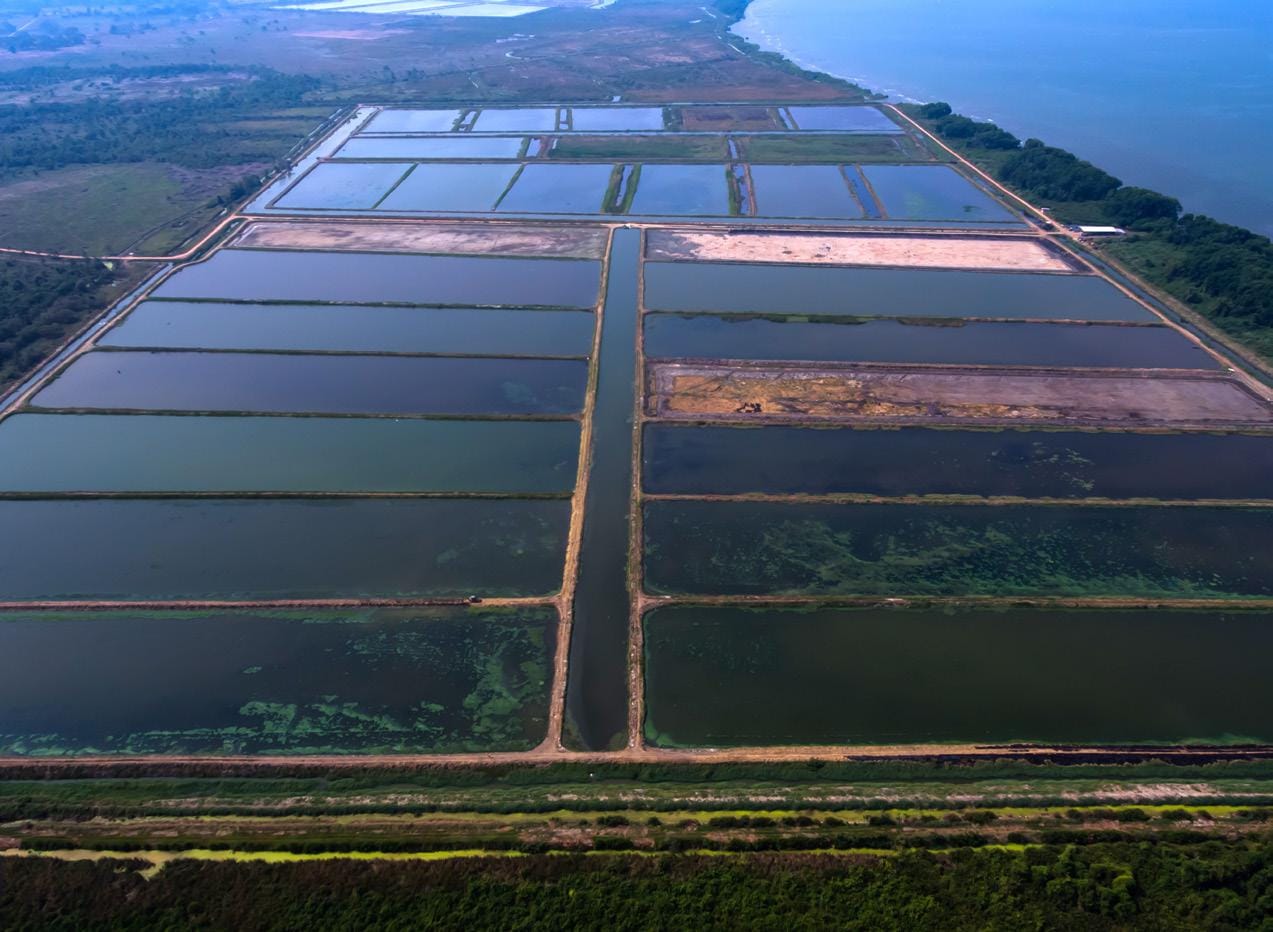
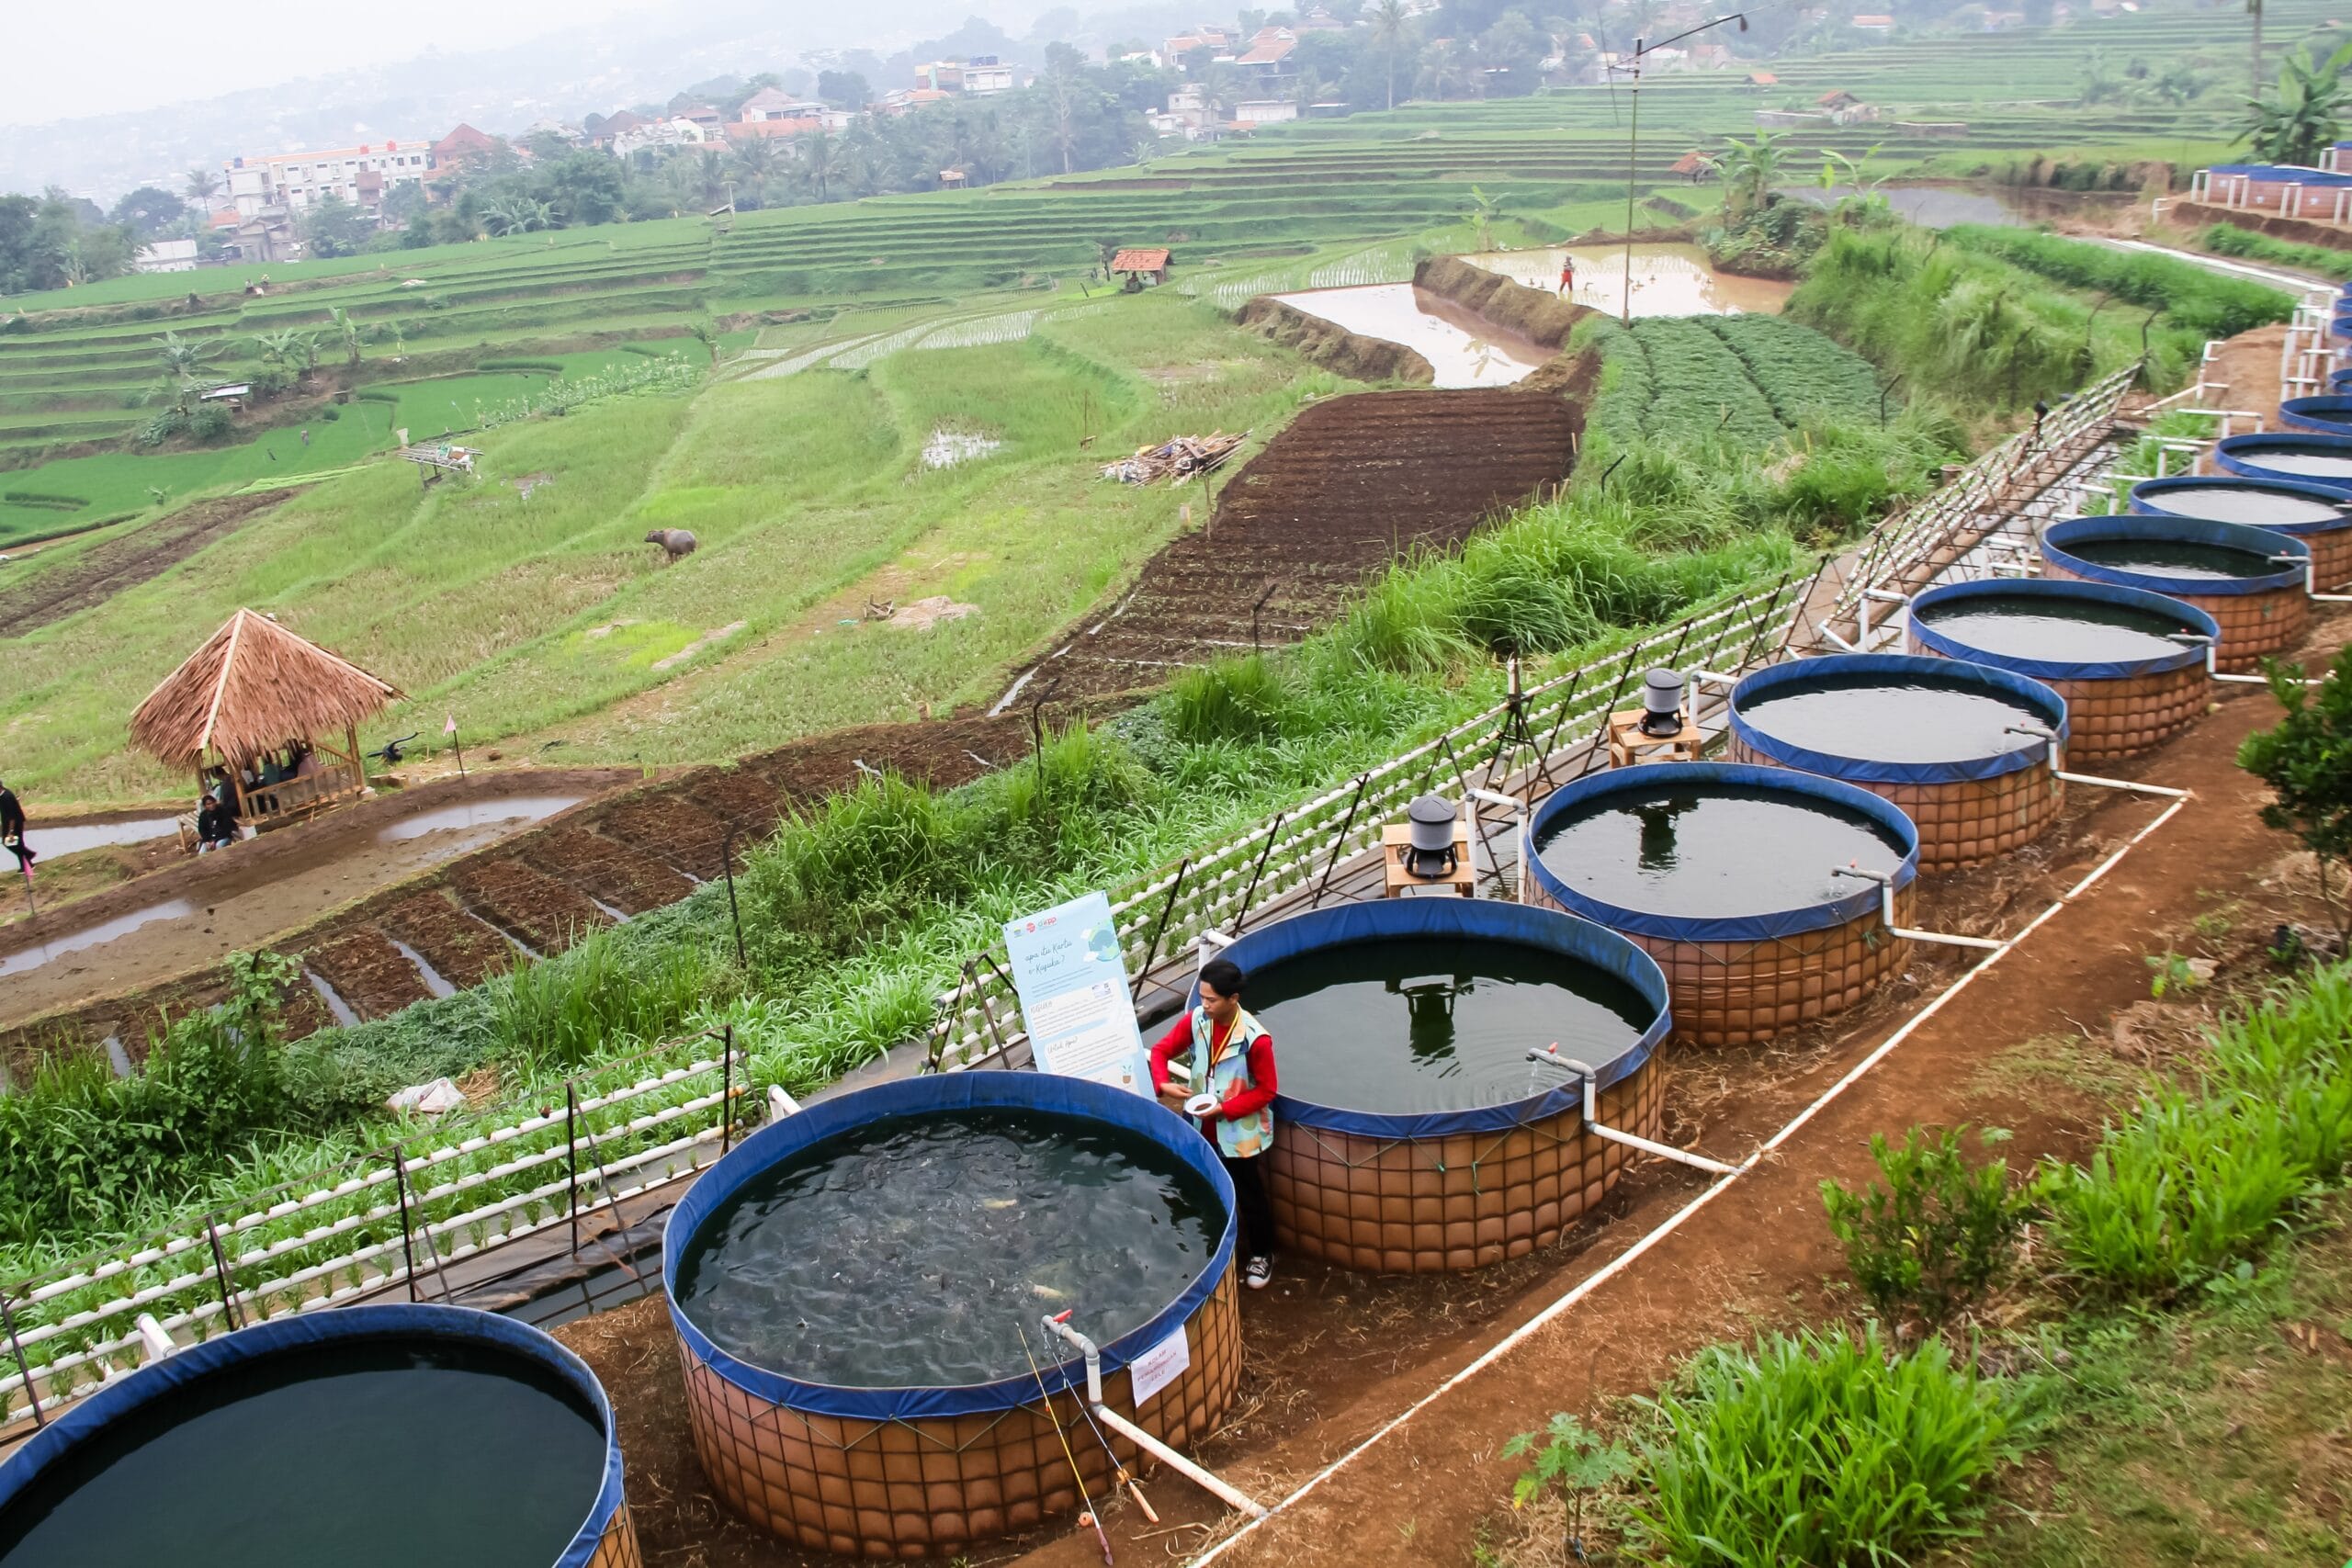
Global aquaculture has expanded more than thirtyfold since 1970 and is now practiced in nearly 200 countries, becoming a central pillar of the world’s food system, yet this growth remains highly uneven: 90% of global production is concentrated in only 10 countries. Such imbalance raises concerns about missed opportunities, limited diversity, and the resilience of global food systems in a changing world.
Concerns about global food security and nutrition ─ intensified by population growth and climate change ─ have increased interest in aquatic food production, particularly aquaculture.
As one of the world´s fastest-growing food sectors, global aquaculture output has expanded more than 30-fold, from 3.7 million tons (MT) in 1970 to 123 MT in 2020, driven by production in nearly 200 countries, including non-sovereign territories. This rapid growth has elevated aquaculture as a key component of the global food system.
However, expansion has been highly uneven: the top 20 aquaculture countries accounted for over 95% of global growth between 1970 and 2020, and by 2020, 90% of world aquaculture production was concentrated in just 10 countries, with the largest alone contributing 57%. In comparison, the top 10 countries accounted for 57% of capture fisheries and 62% of territorial meat production.
Although differences in aquaculture development can reflect comparative advantages, the extreme concentration of production raises concerns about missed opportunities and misguided policy approaches. Despite routine monitoring, no comprehensive and quantitative assessment of this imbalance exists. Current evaluations rely largely on ad hoc comparisons, such as the production shares of top countries. Moreover, although aquaculture is often promoted as a diverse food production system capable of enhancing global food systems resilience, limited attention has been given to the lack of diversity in production sources,
This study addresses these gaps through a systematic, quantitative assessment of aquaculture distribution across countries and regions.

Method and Data
This study develops a 10-indicator system to assess how aquaculture production is distributed among countries and regions from 1970 to 2020. Drawing on the Food and Agriculture Organization of the United Nations (FAO) databases, the analysis examines global patterns, regional differences, and imbalances across a wide variety of country groups and species groups. The framework adapts concepts originally used to measure biological diversity and applies them to production systems.
The indicator system includes: total production (1), total number of aquaculture countries (
2), effective number of countries (ENC) (
3), intra-regional diversity (
4 and
5), popularity (
6), evenness (
7), parity (
8), intra-regional parity (
9), and inter-regional parity (
10). While all indicators are calculated, the study places special emphasis on popularity, parity, intra-regional parity, and inter-regional parity for comparing imbalances across time and country groups.
Aquaculture distribution is analyzed globally and across 85 country groups, organized into five categories: the world and “rest of world” excluding China, 27 geographic groups; 19 economic groups (e.g., NAFTA, ASEAN, EU); 17 development groups (including income and Human Development Index [HDI] classes); and 20 resource-based groups categorized by population, land area, coastline, inland waters, and freshwater resources.
Results
Global aquaculture popularity and parity
Long-term trends (1970-2020): rising popularity, declining parity. In 1970, global aquaculture was a minor contributor to food production, yielding 3.7 MT, or 5.5% of total fisheries output. Only 62 of 199 countries practiced aquaculture, giving it a popularity of 31.2% (Figure 1a). Production was unevenly distributed across both countries and regions, resulting in low global parity (5.3%) and inter-regional parity (38.2%) (Figure 1a-b).
By 2020, aquaculture reached 123 MT─57.3% of total fisheries production ─and popularity rose to 84.5% (Figure 1a), with 196 of 232 countries participating. Despite this expansion, global parity dropped to 2.8% accompanied by declines in intra-and-inter-regional parity (Figure 1a-b) as production became increasingly concentrated within Asia.
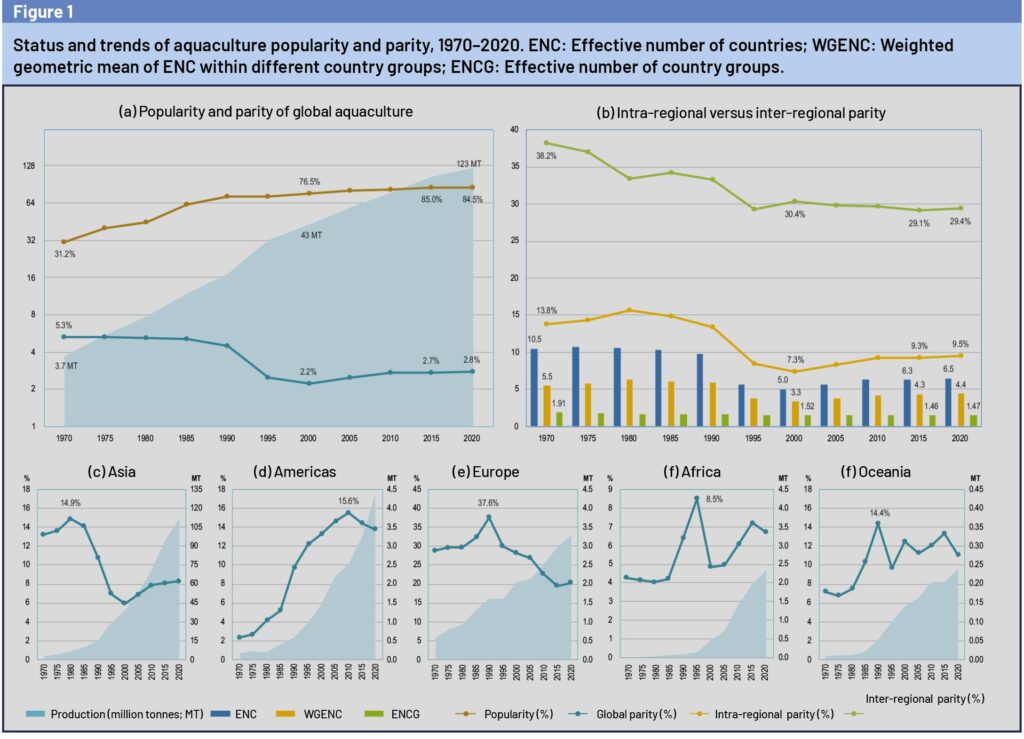
2000-2022: increasing global parity despite falling inter-regional parity. Between 2000 and 2020, inter-regional parity declined slightly (Figure 1b) due to Asia´s rising dominance, yet global parity increased thanks to higher intra-regional parity driven primarily by diversification within Asia as China´s share diminished. A slight rise in inter-regional parity after 2015 (from 29.1% to 29.4%) suggest a potential shift.
These trends reflect decelerating growth in Asia ─ especially China — and modest acceleration in the Americas and Oceania. Still, recent growth rates in other regions remain far Asia´s historical pace.
Comparisons with other production systems
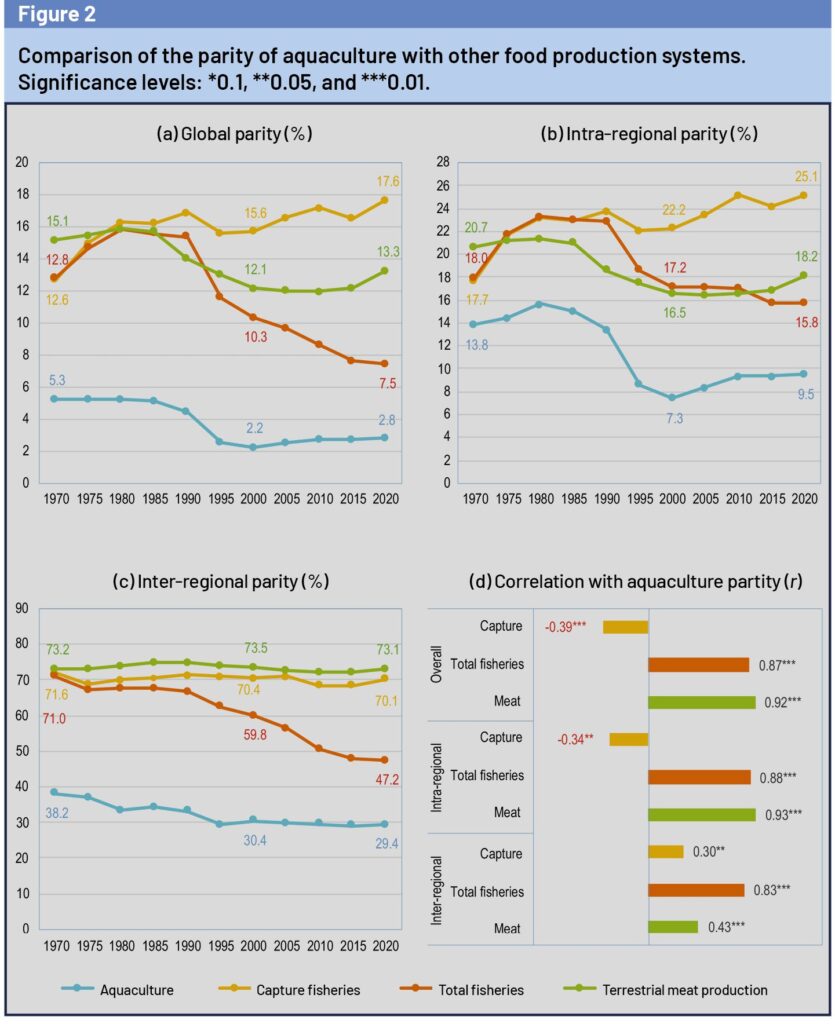
Capture fisheries practiced in nearly all countries ─ has consistently shown much higher parity than aquaculture (Figure 2a-c). From 1970 to 2020, capture fisheries parity increased (12.6% to 17.6%), while aquaculture parity decreased (5.3% to 2.8%). Total fisheries parity declined as aquaculture expanded, whereas terrestrial meat parity rose slightly in the new millennium (Figure 2a-c). Parity trends in terrestrial meat and aquaculture were strongly correlate (r = 0.93) (Figure 2d).
Popularity and parity across country groups
Aquaculture popularity rose in all 85 country groups. In 2020, only 35 countries lacked aquaculture, many of them island economies or Small Island Developing States (SIDS), and collectively accounting for minimal global fisheries or meat output.
Despite declining global parity, aquaculture parity increased in most country groups (58 of 85), including 18 geographic, 14 economic, 12 development, and 14 resource groups. From 200 to 2020, parity rose in 50 groups, including Africa, the Americas, and Asia.
Aquaculture expansion at the global level showed a significant negative correlation between production and parity (r = -0.74), but within-country groups it was generally balanced: 42 groups showed positive correlations, compared to only 21 negatives. In contrast, capture fisheries and terrestrial meat production showed more widespread imbalances.
In 2020, aquaculture parity was lower than both comparator systems in 63 of 85 country groups, including most Asian and African subregions.
Species-level popularity and parity
Across 43 species groups, popularity increased universally, but remained low for most groups except finfish (82%). Only tilapias exceeded 50% popularity. From 1970 to 2020, parity trends were mixed: 22 species groups increased while 20 decreased. Major groups (finfish, crustaceans, mollusks, algae, MAA) all showed downward long-term trends.
In 2020, species-level parities were uniformly low (0.4% – 4.7%), with tilapias, salmon/trout, and marine shrimps having the highest values. Inter-regional parity ranged from 20% to 63.3%, highest for mussels and salmon/trout. Across all major groups, aquaculture parity remained far below that of capture fisheries.
Discussion
Aquaculture has transformed from a niche practice in about 60 countries in 1970 into a global food-production system present in nearly 200 countries by 2020. However, this “globalization” is largely driven by finfish farming now practiced in over 80% of countries.
In contrast, most of the 43 species groups analyzed ─ especially mollusks, crustaceans, algae, and miscellaneous aquatic animals have aquaculture popularities below 50% far lower than their capture fisheries counterparts. Thus, despite the overall high popularity of aquaculture (Figure 1a), substantial room remains for expanding underdevel-oped, often eco-friendly species such as algae and mollusks.
Aquaculture´s massive expansion from < 4 MT in 1979 to > 120 MT in 2020 ─ has nevertheless reduced global parity to below 3%. This reflects rapid growth in a small number of forerunner countries, especially in Asia, widening disparities between Asia and other regions. Yet within many regions, aquaculture has become more balanced as younger industries catch up to established ones. Asia itself experienced internal diversification after 2000, and modest convergence between regions emerged after 2015. Still, aquaculture remains the least diverse food-production system: in 2020, global output corresponded to 6.5 Effective Number of Countries (ENC), compared to ~40 ENC for capture fisheries and ~30 ENC for terrestrial meat.
Low aquaculture parity often co-occurs with low parity in other food-production systems, reflecting structural differences in geography, climate, resource endowment, and socioeconomic conditions. Resource-rich countries tend to dominate all food sectors, while small island states and countries with limited resources contribute little. Yet many well-resourced nations show disproportionately low aquaculture shares relative to their fisheries and livestock production, indicating that aquaculture’s unique barriers — not just natural factors — shape its imbalance.
These imbalances raise concerns about aquaculture’s capacity to enhance global food-system resilience. Although aquaculture is often promoted as a diversification tool, its rapid but uneven expansion has reduced the parity of total fisheries production, even as parity increased within both aquaculture and capture fisheries. This undermines resilience to climate, ecological, socioeconomic, and geopolitical risks.
Recent increases in global aquaculture parity suggest slow correction of these imbalances, but improvements remain modest and driven mainly by slowing Asian growth rather than significant acceleration else-where. Africa — despite vast resource potential — has seen parity decline (Figure 1f, and projections indicate persistent unevenness to 2050.
Yet high disparity signals large untapped potential. In 2020, 147 countries produced less aquaculture relative to both fisheries and livestock benchmarks; bringing them to parity could add 26 MT globally. Success stories like Egypt — Africa’s dominant producer despite limited natural resources — demonstrate that strong aquaculture development is attainable regardless of endowment.
Unlocking this potential requires recognizing production gaps, addressing regulatory and financial barriers, and adopting popularity and parity metrics as mainstream policy tools. The indicator system developed here enables continuous monitoring, supporting more inclusive, diversified, and resilient aquaculture growth worldwide.
Conclusion
The space constraints have prevented an exhaustive analysis of all the information generated by our assessment, including results related to other food production systems (i.e., capture fisheries and terrestrial meat production), which served as benchmarks for evaluating aquaculture performance.
To facilitate a more comprehensive understanding, we have documented detailed results in the supplementary materials. Future studies could delve deeper into these findings, exploring their implications for the sustainable development of aquaculture and other food produc- tion systems.
Moreover, the value of the indicator system proposed here can be amplified by extending its ap- plication to diverse sectors or scales, such as subnational assessments. Such a broader application can ex- pand and refine our understanding of the dynamics within the global food production landscape.
This is a summarized version developed by the editorial team of Aquaculture Magazine based on the review article titled “POPULARITY AND PARITY ASSESSMENT FOR MORE INCLUSIVE AND BALANCED AQUACULTURE DEVELOPMENT” developed by: Cai, J. ─ Fisheries and Aquaculture Division, Food and Agriculture Organization of the United Nations (FAO) and Leung, P. -University of Hawai’i. The original article, including figures, was published on OCTOBER, 2024, through SCIEN- TIFIC REPORT. The full version can be accessed online through this link: https:// doi. org/10.1038/ s41598- 024- 68325-7