


* By Aquaculture Magazine Editorial Team
Estuaries and coastal wetlands are critical carbon hotspots, releasing vast amounts of CO2 annually. In China, aquaculture expansion has transformed these ecosystems, but also intensified greenhouse gas emissions. Earthen aquaculture ponds, plastic-lined ponds, and mangrove wetland eco-aquaculture systems present contrasting impacts on carbon fluxes. Understanding how salinity, nutrient dynamics, and systems design influence CO2 emissions is key to advancing sustainable coastal aquaculture management.
Estuaries and coastal wetlands, positioned between ocean and land, are major hotspots for carbon emissions. Annual carbon dioxide (CO2) emissions from estuarine waters are estimated to reach 0.25 petagrams of CO2-carbon (Pg CO2-C), making them significant contributors to atmospheric CO2. In recent years, many estuarine and coastal zones have been reclaimed for aquaculture ponds to meet the growing demand for fishery products. However, this rapid development has intensified environmental challenges, particularly greenhouse gas emissions.
China currently has the largest global coverage of aquaculture ponds, with an estimated 15,633 km2 along its coast. The use of feed, fertilizers, and high stocking densities contributes to nutrient and carbon accumulation in pond waters and sediments. Elevated organic loads can increase subsequent CO2 release into the atmosphere. Emissions vary by aquaculture systems, site, and management practices, yet empirical data remain limited. Most previous research has concentrated on earthen aquaculture ponds (EAP), while systems such as plastic-lined aquaculture ponds (PLAP) and mangrove wetland ecoaquaculture systems (MWEAS) have received little attention.
Coastal aquaculture ponds typically rely on seawater from nearby coats, where salinity and nutrient levels differ by region. Some evidence indicates that higher salinity ponds release less CO2 and can even function as carbon sinks, whereas other studies suggest that nutrient-rich, high-salinity waters may stimulate ecosystem respiration, thus enhancing CO2 emissions.

This study investigates CO2 emission fluxes in three aquaculture system types within an estuarine area in Guangxi Province (Zhuang Autonomous Region), South China: EAP, PLAP, and MWEAS. The research objectives are twofold: first, to quantify CO2 emission fluxes and their temporal variations across farming stages in these three systems; and second, to evaluate the influence of salinity and other environmental parameters on CO2 emissions.
Two hypotheses are proposed:
» CO2 flux differs significantly among the three systems, with PLAP and MWEAS exhibiting lower emissions compared to EAP; and
» Higher salinity reduces CO2 emission fluxes from estuarine aquaculture ponds.
By comparing these systems under varying environmental conditions, the study aims to provide insights into the role of aquaculture practices in regulating carbon dynamics and contributing to sustainable management of coastal ecosystems.
Material and Methods
This study was carried out at Zhulin Farm (21.45° N, 109.30° E), located at the mouth of the Fucheng River in Beihai City, Guangxi, South China. The area has a subtropical marine monsoon climate with an average annual temperature of 17.2°C and rainfall of 1,428.2 mm. Seawater salinity averages 30% but fluctuates seasonally. The landscape includes mangrove wetlands, reservoirs, ditches, and aquaculture ponds, mainly established by clearing wetland vegetation.
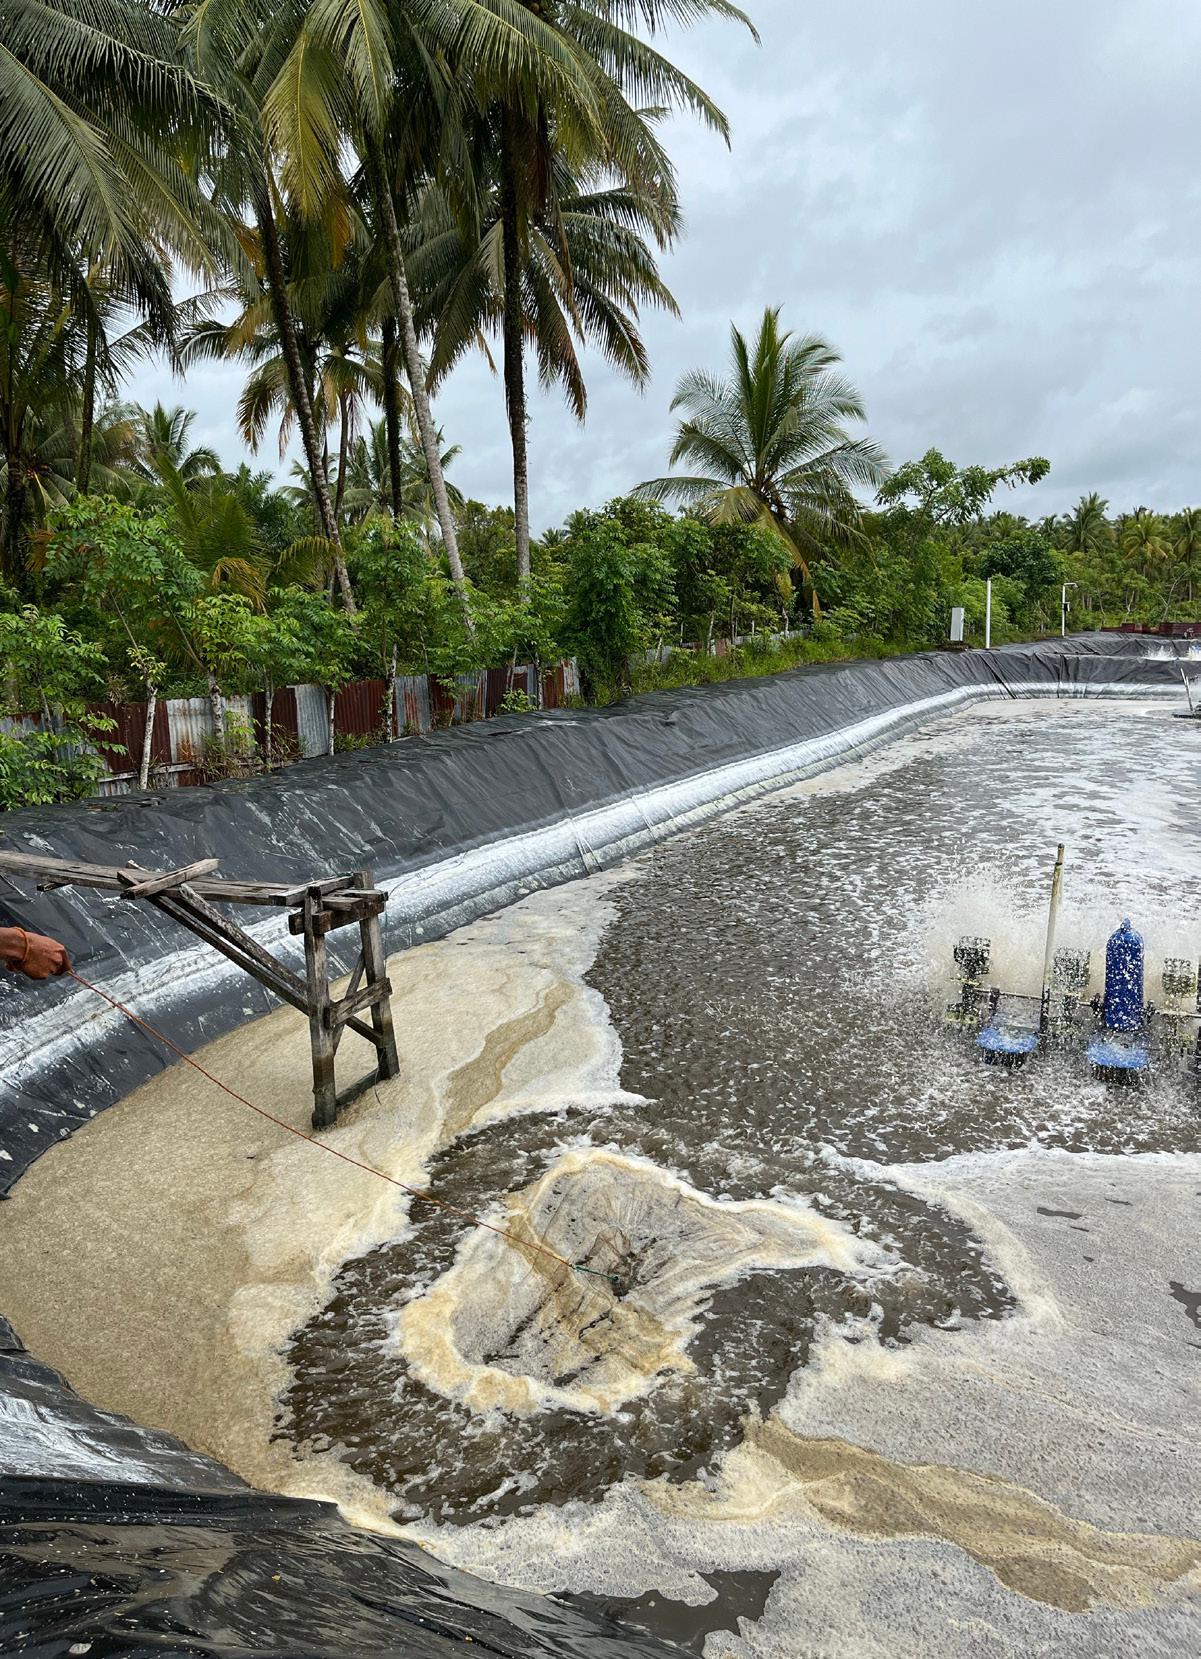
The aquaculture systems investigated were EAP, PLAP, and MWEAS.
For sampling, Three EAPs, three PLAPs, and two MWEASs were selected. Each EAP and PLAP had three sampling points, while MWEAS had five. Sampling was conducted during different farming stages – June (initial), September (growth), and December (final) of 2021, between 9:00 and 11:00 a.m. Carbon dioxide (CO2) emission fluxes were measured with the floating chamber method.
Results
Variations in environmental parameters
Environmental parameters varied significantly between system types (p < 0.05), except for water temperature (p > 0.05). Water in the PLAP had a higher pH (8.60 ± 0.48) than EAP (8.47 ± 0.65) and MWEAS (8.27 ± 0.23) (p < 0.05).
The average total phosphorus (TP) and c concentrations in MWEAS (TP: 0.27 ± 0.06 mg L−1, PO 3−4: 0.11 ± 0.03 mg L−1) and PLAP (TP: 0.29 ± 0.09 mg L−1, PO 3−4: 0.19 ± 0.06 mg L−1) were significantly higher than those in EAP (TP: 0.09 ± 0.01 mg L−1, PO 3−4: 0.04 ± 0.01 mg L−1) (p < 0.01). There were temporal changes in the environmental parameters, with higher phosphorus (P) nutrient concentration in the initial stage and higher pH level in the final stage (p < 0.01).
Variations in Chlorophyll-α concentrations
Chlorophyll-α (Chl-α) concentration ranged from 21.84 to 98.28 μg L−1 in EAP, 32.76 to 333.06 μg L−1 in PLAP, and 24.57 to 185.64 μg L−1 in MWEAS (Figure 1a). Compared to EAP (59.89 ± 20.68 μg L−1), the average Chl-α concentrations in PLAP (109.53 ± 91.29 μg L−1) and MWEAS (117.34 ± 42.04 μg L−1) were significantly higher (p < 0.01). In terms of farming stages, all system types exhibited a similar temporal pattern, with Chl-α concentration being significantly higher in the initial stage than in the growth and final stages (p < 0.01).

Variations in CO2 emiIIion fiux
Significant variations in CO2 emission flux were observed between system types (p < 0.01) (Figure 1b). CO2 emission flux ranged from 2.76 to 19.30 mg m−2 h−1 in EAP, − 27.28 to 12.39 mg m−2 h−1 in PLAP, and − 17.78 to 14.18 mg m−2 h−1 in MWEAS. On average, EAP served as a source of atmospheric CO2 (8.96 ± 4.88 mg m−2 h−1), while PLAP (− 0.61 ± 12.4 mg m−2 h−1) and MWEAS (− 0.41 ± 9.03 mg m−2 h−1) acted as sinks (p < 0.01). Across the different farming stages, PLAP and MWEAS functioned mostly as carbon sinks in the initial stage, with average values of − 16.60 ± 6.78 and − 10.87 ± 6.34 mg m−2 h−1 respectively, which substantially offset their CO2 emissions in the subsequent farming stages (Figure 1b).
EffectI of environmentat parameters on CO2 emiIIion fiux
Relationships between CO2 emission flux and environmental parameters are presented in Figure 2. In general, CO2 emission flux from these aquaculture systems were significantly and positively correlated with water temperature and DOC concentration (p < 0.05), while negatively with salinity, phosphorus concentrations (TP and PO43− ), and Chl-α concentration (p < 0.05).

Structural equation model (SEM) considering the effect of system type and farming stage explained 76% and 88% of the variations in Chl-a concentration and CO2 emission flux, respectively. The standardized total effect (STE) indicated that temperature changes had the greatest impact on CO2 emission flux (STE = 0.78), followed by TP (STE = 0.69), farming stage (STE = 0.45), Chl-α concentration (STE = 0.39) and system type (STE = 0.36). Based on standardized direct effects (SDE), TP (SDE = 0.44), Chl-α concentration (SDE = 0.39) and temperature (SDE = 0.36) had significant direct effects on CO2 emission flux.
Discussion
The balance between photosynthesis and respiration largely determines carbon dioxide (CO2) emission flux in aquatic ecosystems. In this study, plastic-lined aquaculture ponds (PLAP) and mangrove wetland ecoaquaculture systems (MWEAS) supported higher phytoplankton biomass than earthen aquaculture ponds (EAP); as indicated by Chlorophyll-α (Chl-α) concentration nearly twice those in EAP (Figure 1a). CO2 emission flux was negatively correlated with Chl-α, suggesting that phytoplankton photosynthesis reduced CO2 levels, leading to net absorption in PLAP and MWEAS. Phosphorus availability reinforced this effect, with total phosphorus (TP) and phosphate (PO43-) positively related to Chl-α and negatively to CO2 flux (Figure 2).
PLAP exhibited significantly lower emissions than EAP due to structural differences. The plastic liner limited sediment-water interactions, restricting organic matter mineralization and subsequent CO2 release, Moreover, PLAP showed more efficient feed utilization and reduced dissolved organic carbon (DOC), which was positively correlated with CO2 emissions . MWEAS further benefited from mangrove vegetation, particularly Kandelia obovate, whose roots secrete tannins and polyphenols that inhibit microbial decomposition, slowing sediment organic matter breakdown and reducing emissions.
CO2 flux also varied across farming stages, following a consistent trend: growth stage > final stage > initial stage (Figure 1b). Higher water temperature (WT) during the growth stage increased respiration and decomposition, while greater feed input added organic substrates, both boosting CO2 production (Figure 2a, 2b). Interestingly, net CO2 absorption occurred in PLAP and MWEAS at the initial stage despite temperatures above 25°C, likely due to optimal conditions for phytoplankton growth, which peaked in Chl-α concentration before declining as temperature surpassed the threshold for productivity.
The overall fluxes observed (- 27.28 to 19.30 mg m-2 h-1; mean 2.54 ± 1.11 mg m-2 h-1) were lower than in nearby freshwater and brackish systems but higher than in high-salinity ponds. A clear negative relationship between salinity and CO2 flux was found indicating that higher salinity suppresses microbial metabolism and enhances carbon retention. This finding aligns with national emission reduction strategies, suggesting salinity management, plastic liners, and eco-aquaculture practices as effective mitigation measures.
Limitations include the absence of measurements during non-farming stages and nighttime, as well as limited insights into microbial mechanisms. Addressing these gaps will improve future evaluations of aquaculture’s role in carbon cycling and its potential emission reduction.

Conclusions
When you compare CO2 emission flux from three aquaculture systems: earthen aquaculture ponds (EAP), plastic-lined aquaculture ponds (PLAP), and mangrove wetland ecoaquaculture systems (MWEAS), you will find that PLAP and MWEAS act as net CO2 sinks during the initial farming stage. This is mainly due to higher primary productivity and lower levels of organic substrate. However, as farming progresses, both systems shift toward net CO2 emissions, similar to traditional earthen ponds. Overall, you can expect PLAP and MWEAS to function as CO2 sinks, while EAP will remain a CO2 source. By integrating high-salinity water into your coastal aquaculture management, you can further reduce CO2 emissions, since elevated salinity slows down organic matter degradation.
Implementing plastic liners, adopting ecological aquaculture systems, and managing with high-salinity water provide you with effective strategies to mitigate CO2 emissions in aquaculture operations.
This informative version of the original article is sponsored by: REEF INDUSTRIES INC

This is a summarized version developed by the editorial team of Aquaculture Magazine based on the review article titled “PLASTIC-LINED PONDS AND ECO-AQUACULTURE SYSTEMS HAD LOWER CO2 EMISSIONS THAN EARTHEN AQUACULTURE PONDS)” developed by: MIN LV – Shaoyang Univer- sity and Fujian Normal University; ZHINAN SU AND GUANGLONG QIU -Guangxi Academy of Sciences; KAM W. TANG – Texas A&M University: YAN HONG, JIAFANG HUANG, WANYI ZHU AND PING YANG – School of Geographical Sciences; YIFEI ZHANG – Institute of Changjiang Water Environment and Ecological Security; YINGYI CHEN – Wuhan Regional Climate Center; HONG YANG – University of Reading. The original article, including tables and figures, was published on JULY 2024, through JOURNAL OF HIDROLOGY. The full version can be accessed online through this link: https://doi.org/10.1016/j.jhydrol.2024.132601


