
Editorial Staff | Aquaculture Magazine
Source: Aquaculture Magazine editorial analysis of 11 sources published between 2023 and 2026, including peer-reviewed studies, industry reports and trade statistics. See Sources and Methodology.
About 94% of the shrimp eaten in the United States is imported, and domestic prices now follow the global market. Recent research shows that consumers buy on price, convenience and physical quality, while farmed shrimp still trails wild shrimp in public perception.
Shrimp remains the most consumed seafood in the United States
Shrimp is the leading seafood species in US consumption, ahead of salmon and canned tuna. Per capita consumption peaked at 5.9 pounds in 2021 and declined slightly in 2022, according to Mississippi State University Extension.
The same analysis ranks Japan first worldwide in per capita shrimp consumption, at 7.23 pounds, with the United States second. About 94% of the shrimp consumed in the US is imported, mainly farmed shrimp from Asia and Latin America.
Preliminary estimates from the market analytics firm Expana indicate that per capita consumption in 2025 was essentially flat compared with 2024.
Domestic shrimp prices track imported shrimp
Prices received by US shrimp harvesters closely follow the price of imported frozen shell-on shrimp, according to Asche, Oglend and Smith in Marine Resource Economics (2026). Using cointegration analysis, the authors conclude that domestic prices are now set in the global market.
The study notes that 79% of the seafood consumed in the US is imported. Real landed value of the US shrimp fishery, the country’s most valuable fishery in the 1980s, has fallen by half since then.
The authors add that policies supporting coastal communities have paid little attention to how imports affect prices received by domestic producers. They expect a similar price structure in other species facing strong import competition.
US shrimp imports rose 2% in 2025 in a year shaped by tariffs
The United States imported 795,641 metric tons of shrimp in 2025, up 2% from 2024, according to Shrimp Insights. The year had two phases: front-loading in the first half ahead of reciprocal tariffs, followed by a sharp correction from August onward.
In 2024, imports of 762,804 metric tons were 3% lower than in 2023 and 15% below the 2021 peak.
Figure 1. US shrimp imports by product form and main supplier, 2024 and 2025, in metric tons. Volumes as first released for each year. Source: Shrimp Insights, reported by World Fishing and SeafoodSource.
Table 1. US shrimp imports by product and main supplier, 2024–2025
| Indicator | 2024 (t) | 2025 (t) | Reported change, 2025 vs. 2024 |
|---|---|---|---|
| Total imports | 762,804 | 795,641 | +2% |
| Peeled frozen shrimp | 377,719 | 408,408 | +6% |
| India | 294,333 | 300,051 | +1% |
| Ecuador | 187,040 | 231,804 | +18% |
Source: Shrimp Insights, reported by World Fishing (2024 data) and SeafoodSource (2025 data). Volumes are as first released for each year. The reported 2025 growth rates imply revised 2024 figures, so they do not match a direct comparison of the two columns.
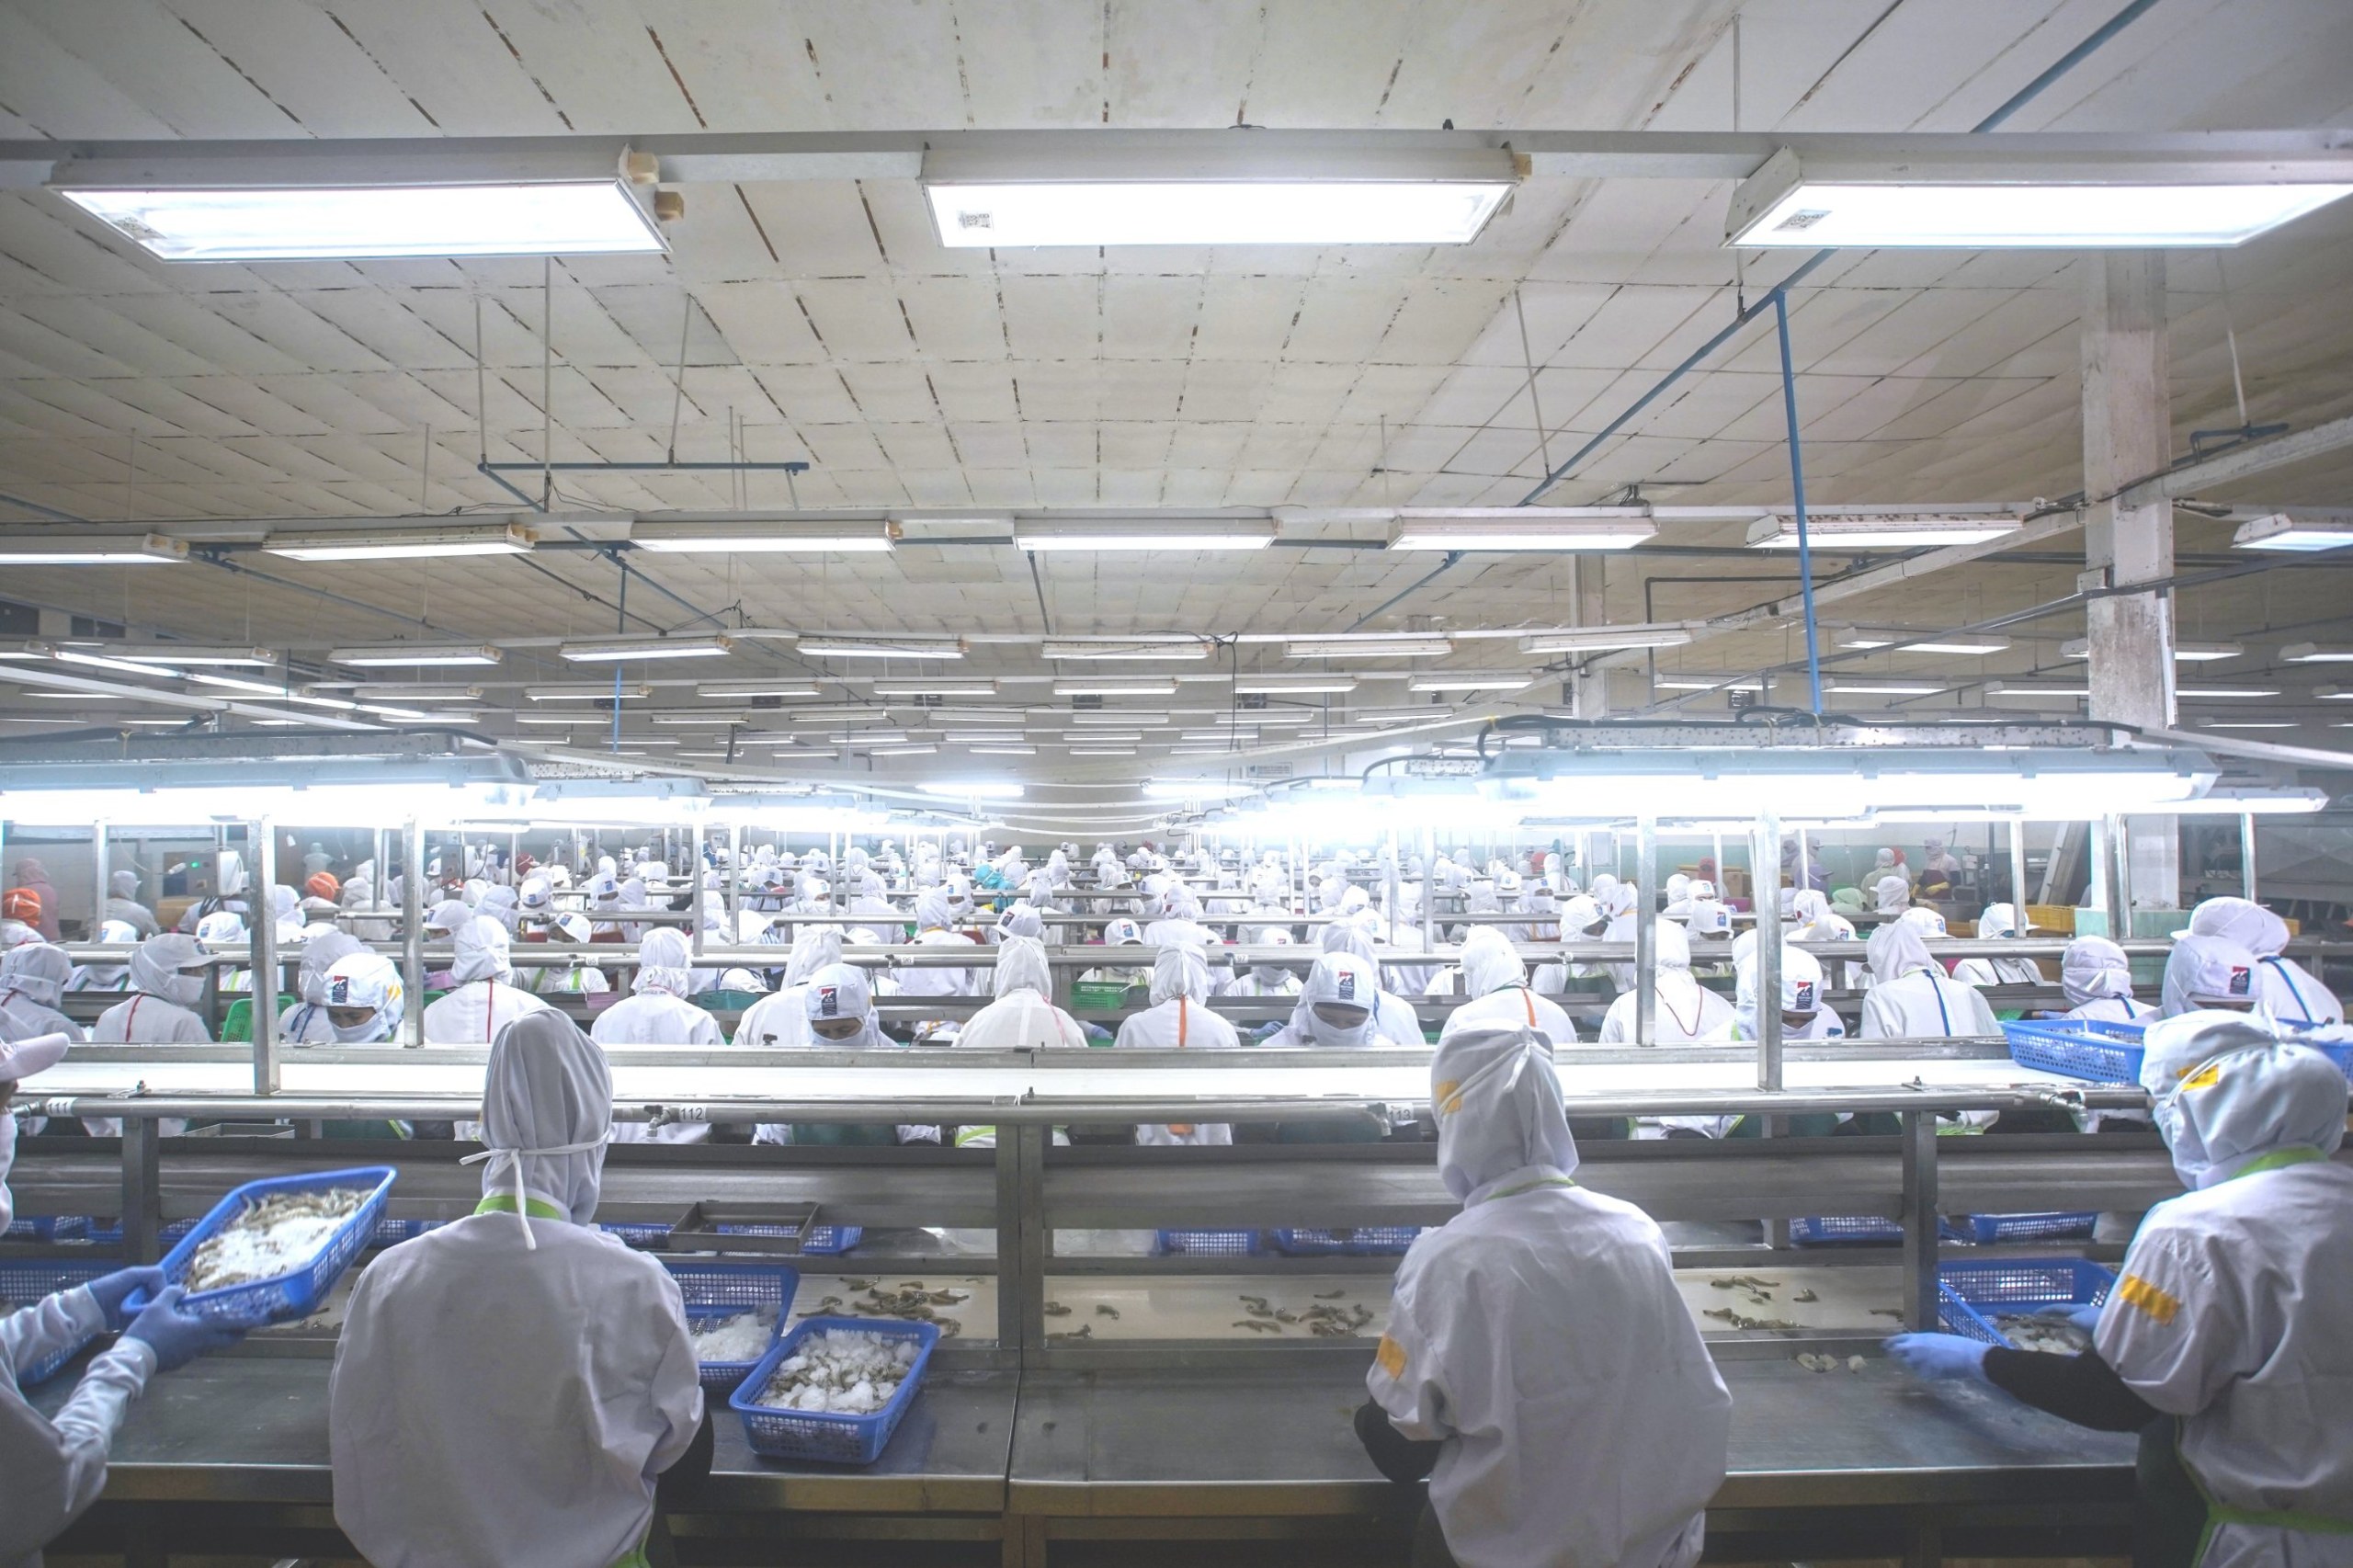
Figure 2. Peeled frozen shrimp, processed in plants like this one, accounted for about half of US shrimp imports in 2025. Photo: Aquaculture Magazine.
Peeled frozen shrimp is the dominant product form and the fastest growing. India remained the leading supplier despite tariffs that reached 50% in mid-2025, while Ecuador posted the largest volume increase.
Price, convenience and physical quality drive US shrimp purchases
Recent evidence agrees that US consumers choose shrimp on price, convenience and physical quality, with sustainability playing a secondary role.
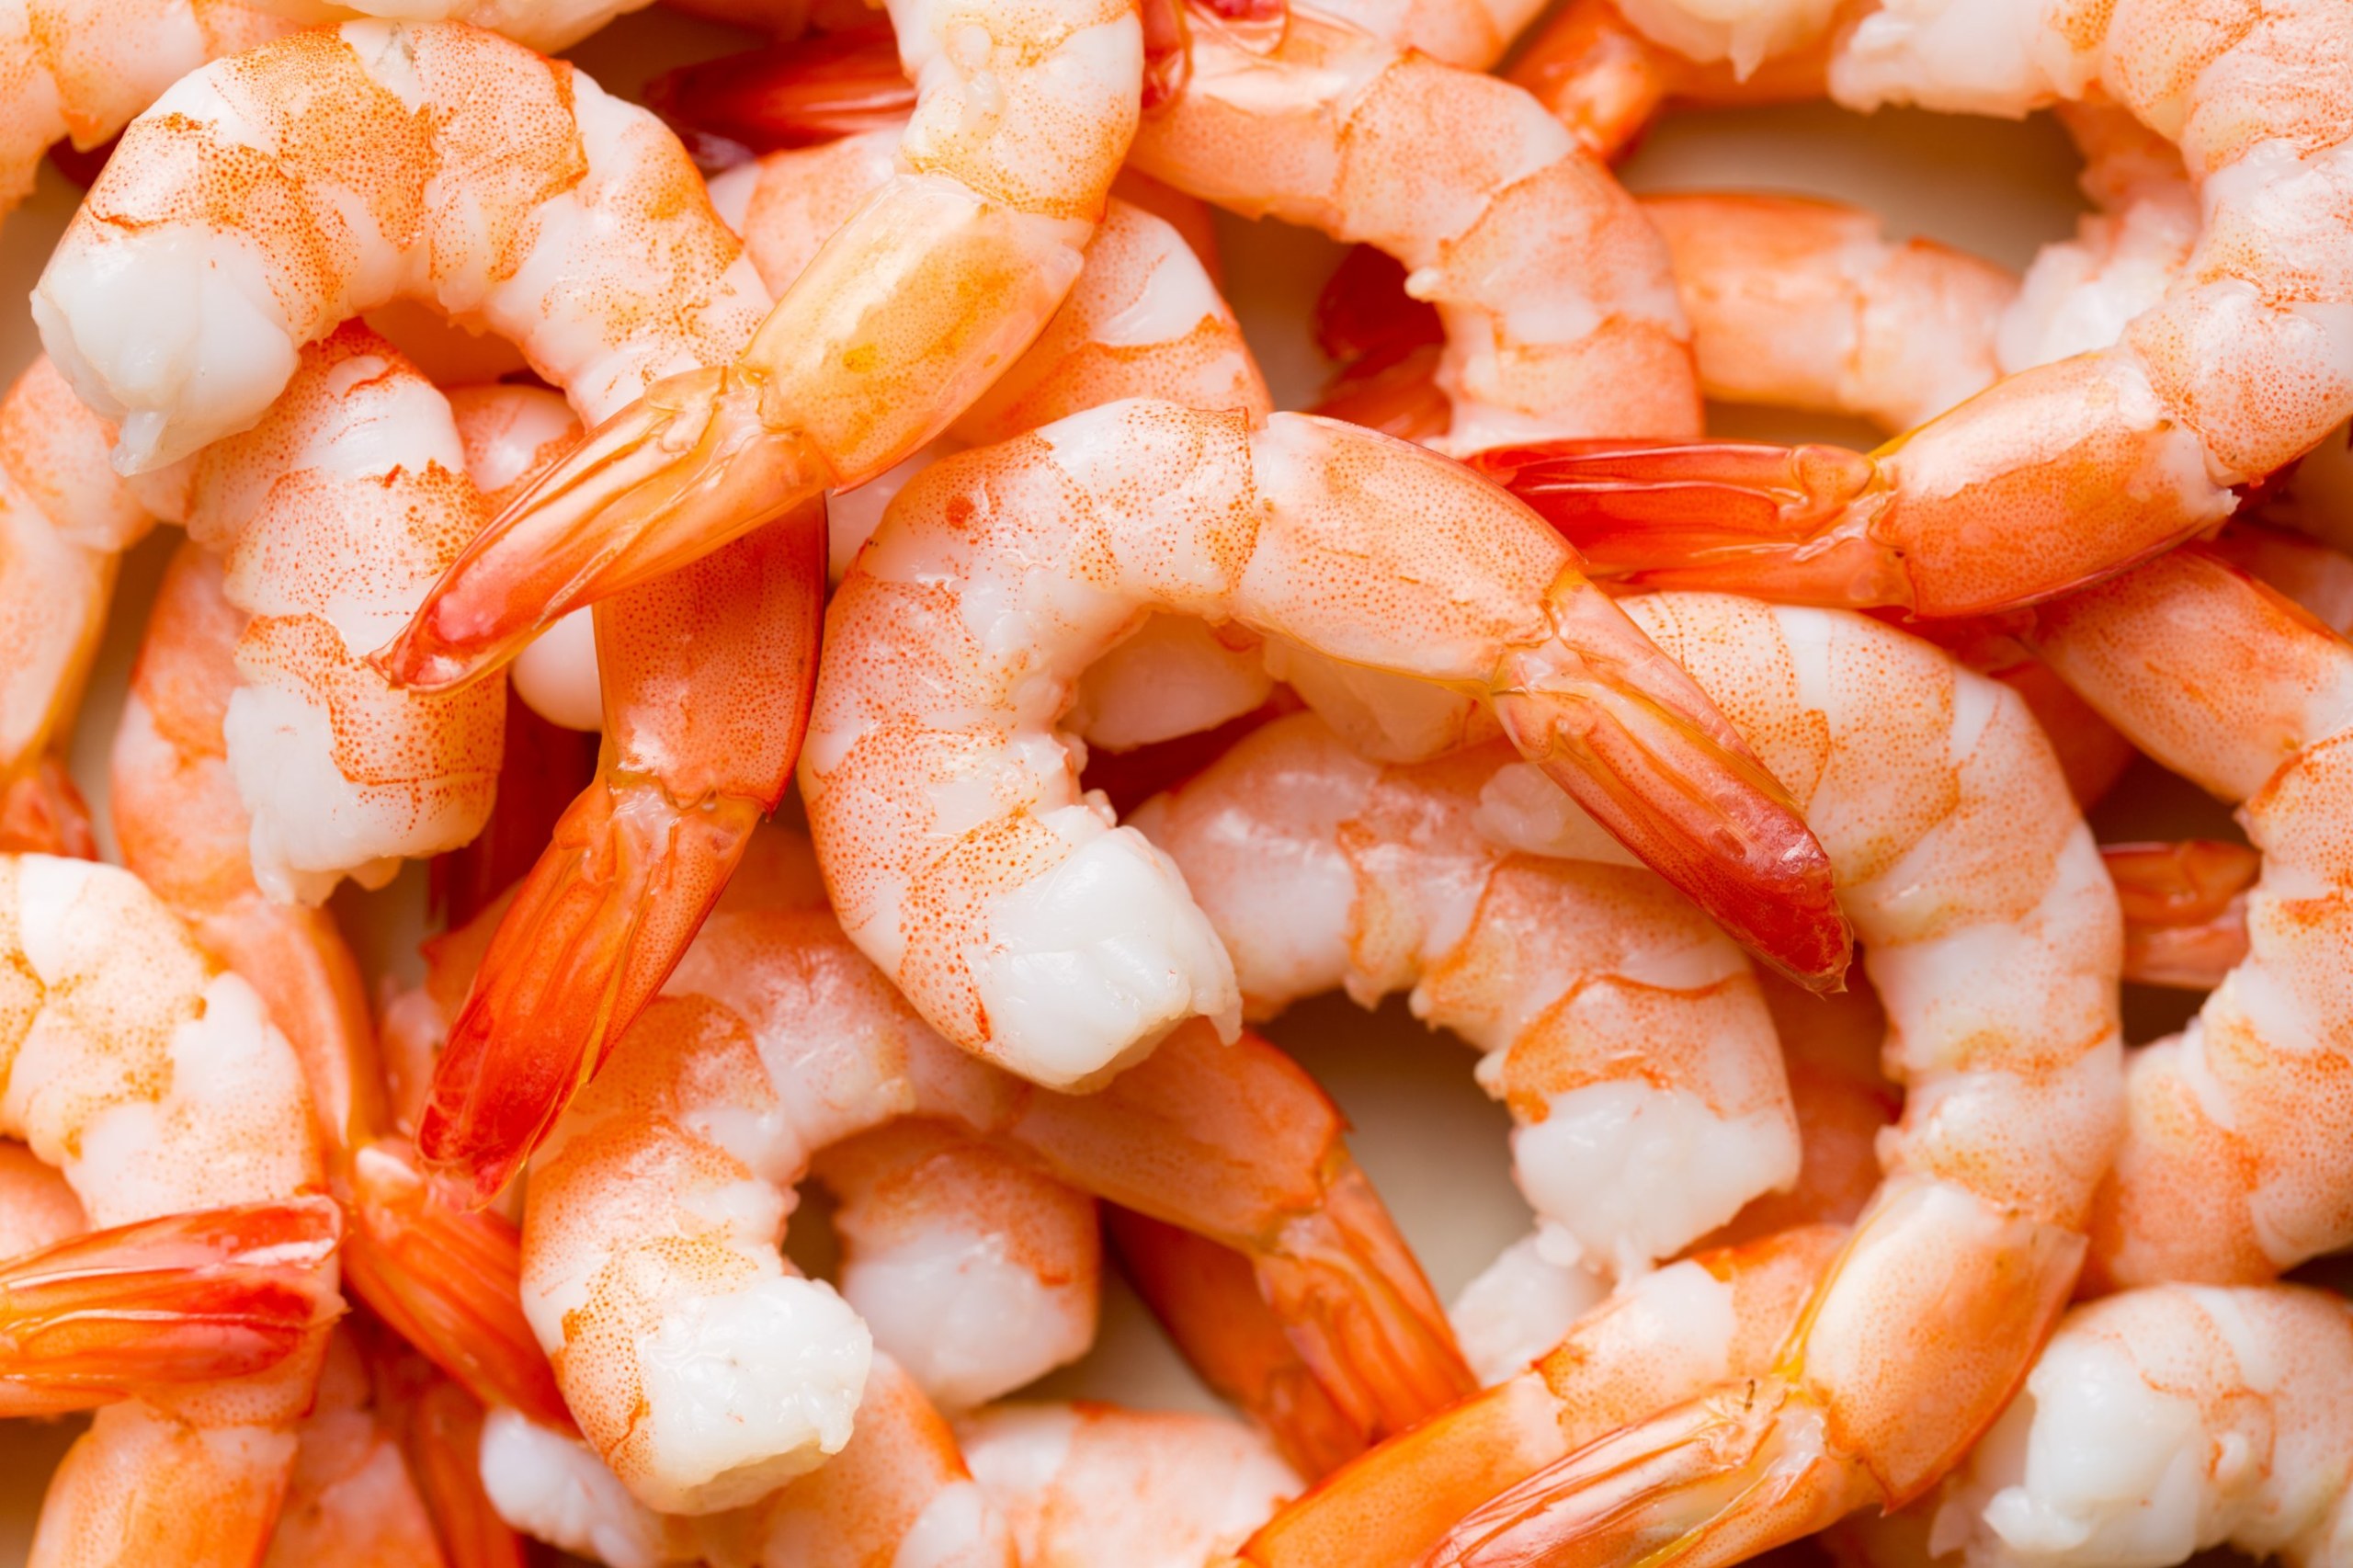
Figure 3. Ready-to-cook and ready-to-eat formats such as peeled shrimp match US demand for convenience. Photo: Aquaculture Magazine.
Tao and Quagrainie (Purdue University), in an online media sentiment analysis published in Aquaculture in 2025, found that physical quality is the main driver of how shrimp is perceived. For salmon, the main driver is environmental impact. Platform X hosts most of the online conversation about both species.
A March 2025 report by the Global Shrimp Forum Foundation, the organization behind the Global Shrimp Council, concludes that environmental concerns play a secondary role in shrimp purchasing decisions. Purchases are driven by the desire to cook at home, to make everyday meals feel special and to prepare quick, wholesome family meals.
The same report finds that many consumers associate shrimp with luxury and believe it costs more than it does. It recommends price promotions across all consumer segments and a focus on younger consumers and people who cook for themselves.
In the US market, physical quality outweighs environmental attributes in how shrimp is perceived and purchased.
What consumers say they prefer does not always match what they choose
A sensory study from the University of Florida, published in 2024, found a gap between stated preferences and actual acceptance. Participants said they preferred shrimp without preservatives, yet rated imported shrimp treated with preservatives more favorably.
The study compared imported farmed shrimp, US wild-caught shrimp and US farmed shrimp. Proximate analysis showed that the US farmed shrimp had significantly higher protein content (p < 0.05) than the wild-caught and imported samples.
The study was published in an undergraduate research journal and used a local consumer panel, so its results are exploratory rather than representative of the national market.
Farmed shrimp trails wild shrimp in public perception
Farmed shrimp consistently shows lower net sentiment than wild shrimp in US online media, and wild shrimp sentiment follows a more positive trajectory, according to Tao and Quagrainie (2025). Dips in wild shrimp sentiment were linked to fishing boat incidents.
The authors also found that attitudes toward farmed shrimp are unstable in the East South Central and Mountain regions. They suggest region-specific communication strategies.
Survey data point in the same direction. Murray and colleagues, in Marine Policy (2023), found that North Carolina consumers consistently stated a preference for wild-caught products, and that tuna, shrimp and salmon are the seafood they eat most often.
This gap coexists with low consumer knowledge of aquaculture. A review by Wang, Okrent, Zhen and Lee, presented at the 2024 annual meeting of the Agricultural and Applied Economics Association, concludes that consumers pay a premium for wild-caught seafood but know little about aquaculture practices. The authors suggest that better information on production methods could change those preferences.
The perception gap of farmed shrimp coexists with low consumer knowledge of how it is produced.
Domestic origin carries a higher premium than certification
In a choice experiment with South Carolina consumers, presented at the 2024 World Fisheries Congress and under review at the time, willingness to pay was 41% higher for locally sourced shrimp. Aquaculture Stewardship Council (ASC) certification on farmed shrimp added a further 7%, a gap consistent with the limited weight of sustainability labels in the US market.
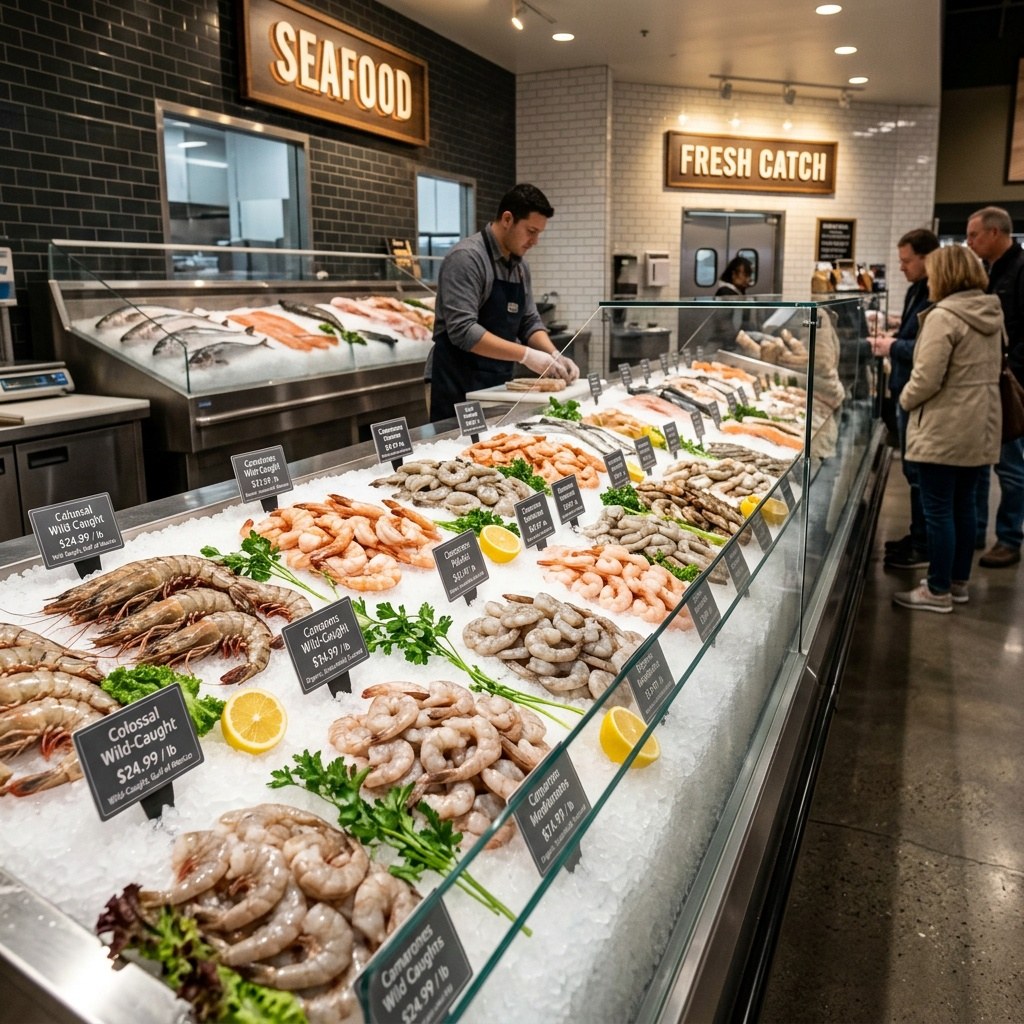
Figure 4. Illustrative image of a US retail seafood counter; signage is not real product or price information. Image: Aquaculture Magazine.
The value of origin is also reflected in labeling fraud. Genetic testing by SeaD Consulting in March 2025 found that 14 of 24 restaurants sampled in Shreveport, Louisiana (58%), implied they served Gulf shrimp while serving imported product. In February 2025, the rate in New Orleans was 13%.
Louisiana strengthened penalties under its menu labeling law, and Alabama passed a law in 2024 requiring restaurants and grocery delis to label shrimp by country of origin or as imported.
No recent national study measures willingness to pay for shrimp
No peer-reviewed, national choice experiment on US willingness to pay for shrimp was identified among studies published between 2023 and 2026. The most robust studies of this type predate 2020 and cover specific states.
A project led by Rutgers University with USDA funding, started in 2023, uses choice experiments to identify which nutrition, health and sustainability attributes would increase purchases of farmed shrimp. Results had not been published at the time of this analysis.
What it means for shrimp farmers exporting to the US
- Your price reference is the imported product. If US prices track imported frozen shell-on shrimp, changes in tariffs and export volumes pass directly into the US market.
- Physical quality is the entry point. Size, texture, freshness and presentation weigh more than environmental attributes in the purchase decision. Growth in peeled frozen shrimp confirms demand for ready-to-cook formats.
- The perception gap is a communication opportunity. Consumers know little about aquaculture and accept imported shrimp well in blind tests. Verifiable information on how farmed shrimp is produced may narrow the gap with wild shrimp.
- Certifications help, but modestly. Sustainability labels add a small premium. They work better as quality assurance than as the main sales argument.
What to measure: product quality at arrival (size uniformity, texture, moisture and additive use), share of value-added formats in your exports, and buyer feedback by US region.
Limits: most consumer studies reviewed cover specific states or online conversation, not a representative national sample.
Frequently asked questions
How much of the shrimp consumed in the United States is imported?
About 94%, mainly farmed shrimp from Asia and Latin America, according to Mississippi State University Extension. The US imported 795,641 metric tons of shrimp in 2025.
Who sets shrimp prices in the US market?
The global market. Asche, Oglend and Smith (2026) show that prices received by US harvesters closely track the price of imported frozen shell-on shrimp.
What drives US consumers to buy shrimp?
Price, convenience and physical quality. A 2025 Global Shrimp Forum Foundation report finds environmental concerns play a secondary role, and a 2025 study in Aquaculture identifies physical quality as the main perception driver.
Do US consumers prefer wild or farmed shrimp?
Wild. Farmed shrimp shows consistently lower net sentiment in US online media (Tao and Quagrainie, 2025), although consumers know little about how farmed shrimp is produced.
How much more will US consumers pay for domestic shrimp?
In a 2024 South Carolina choice experiment, still under review, consumers were willing to pay 41% more for locally sourced shrimp and 7% more for ASC-certified farmed shrimp.
Conclusion
Research published between 2023 and 2026 describes a US shrimp market that depends on imports for about 94% of consumption and in which domestic prices follow the global market. Imports reached 795,641 metric tons in 2025, with peeled frozen shrimp accounting for about half.
Consumers buy on price, convenience and physical quality, while sustainability labels add only a modest premium. Farmed shrimp trails wild shrimp in public perception, but that gap coexists with low knowledge of aquaculture practices.
The main open question is the absence of a recent, national, peer-reviewed estimate of willingness to pay for shrimp in the United States.
Sources and Methodology
Content type: editorial analysis by Aquaculture Magazine. Not sponsored. No conflicts of interest.
Method: review of studies, reports and trade data on US shrimp consumption published between 2023 and 2026, identified through web searches of scientific journals, university repositories and industry media.
Note on the data: the Asche, Oglend and Smith (2026) findings are taken from the published abstract. The South Carolina willingness-to-pay figures come from a conference presentation of a paper under review. The Global Shrimp Forum Foundation report, the Mississippi State University Extension newsletter, the Expana estimate and the SeaD Consulting tests are not peer-reviewed. Import volumes are as first reported by Shrimp Insights. Images are illustrative and do not depict specific companies, farms or markets.
References
- Asche, F., Oglend, A., & Smith, M. D. (2026). The impact of imports on domestic US shrimp prices. Marine Resource Economics, 41(2), 85–99. https://doi.org/10.1086/739083
- Tao, J., & Quagrainie, K. K. (2025). Online media sentiment analysis of shrimp and salmon in the United States. Aquaculture, 595. https://doi.org/10.1016/j.aquaculture.2024.741672
- Fimiano, G., Nau, K., Sims, C., & Farzad, R. (2024). Sensory evaluation of local versus imported shrimp to develop marketing strategies for United States shrimp producers. University of Florida Journal of Undergraduate Research, 26. https://doi.org/10.32473/ufjur.26.135406
- Murray, G. D., Fail, R., Fairbanks, L., Campbell, L. M., D’Anna, L., & Stoll, J. (2023). Seafood consumption and the management of shellfish aquaculture. Marine Policy, 150. https://doi.org/10.1016/j.marpol.2023.105534
- Wang, S., Okrent, A., Zhen, C., & Lee, H. (2024). Demand for farmed and wild-caught fish and seafood. Agricultural and Applied Economics Association Annual Meeting, New Orleans. AgEcon Search
- Global Shrimp Forum Foundation (2025). Attitudes and behaviors of U.S. consumers regarding shrimp. SeafoodSource
- Cheplick, S. (2024). Presentation at the World Fisheries Congress. Oregon State University. Oregon Sea Grant
- Mississippi State University Extension (2025). Impacts of imported shrimp prices on U.S. shrimp dockside prices. PDF
- Shrimp Insights, US import data 2024 and 2025, via World Fishing and SeafoodSource.
- Expana (2025). US shrimp consumption edges up in 2025. SeafoodNews
- SeaD Consulting (2025), restaurant genetic testing, via Louisiana Illuminator and KTAL.
- USDA NIFA (2023). Increasing the capacity and profitability of US aquaculture by matching practical seafood product attributes with post-pandemic consumer demand. Rutgers University. USDA NIFA
Aquaculture Magazine is published by DP International, Inc. and covers technology, research and markets for the global aquaculture industry.