


By Aquaculture Magazine Editorial Team
Evaluation of CLPE- and HDPE- Lined In-Pond Raceway Systems for Tilapia Culture: Enhanced Water Efficiency, Lower Carbon Footprint, and Increased Sustainable Production Density
Efficiency and sustainability in tilapia farming depend on optimizing resource use, reducing waste, and mitigating environmental impacts. Comparing pond systems and In- Pond Raceway Systems shows that rearing — especially feed — drives the highest greenhouse gas emissions, while pond preparation is the most resource – intensive phase. Integrating resource value mapping and carbon footprint methods helps small-scale producers identify inefficiencies and improve sustainable aquaculture performance.
Introduction
Climate change ─ driven by risen resource and energy use ─ has become one of the world’s most sing concerns. In response, the European Union (EU) has introduced measures such as carbon border adjustments, environmental standards, and trade restrictions, encouraging a shift toward sustainable production and consumption. The Greenhouse Gas Protocol (GHG Protocol) is widely used to quantify emissions across Scope 1 (direct), Scope 2 (indirect from purchased energy), and Scope 3 (all other indirect) sources.
Thailand, a major food-exporting nation, emitted 437.18 Mt CO2 in 2019, with agriculture responsible for 15%. Most Thai farmers operate as small- holders with limited access to technology and capital, making accessible resource-management tools essential. Resource assessment includes planning, evaluating, and controlling natural, human-made, and financial inputs. Research identifies two main dimensions:
(1) Improving the efficient use of water, energy, land, and materials; and
(2) Mitigating emissions and environmental impacts such as global warming and eutrophication.
Resource use efficiency
Resource use efficiency focuses on optimizing limited resources while minimizing waste and losses. Traditional indicators — such as water, land, nutrient, or energy use per production unit — offer broad sustainability insights but cannot pinpoint specific inefficiencies. Lean manufacturing tools are increasingly applied in agriculture: Heijunka stabilizes production, layout optimization reduces unnecessary movement, and Value Stream Mapping (VSM) identifies value-added and non-value-added activities, with extensions assessing energy and emissions.
However, these tools provide limited visibility into detailed resource-use points. The Resource Value Mapping (REVAM) tool addresses this gap by mapping resource flows, highlighting waste, and identifying improvement opportunities, though it remains underused in aquaculture.
Environmental impact mitigation
Environmental mitigation evaluates the impacts of resource use, including GHG emissions. Beyond reduction, reuse, and recycling, choices of materials and technologies are critical. Life Cycle Assessment (LCA) is widely used to evaluate impacts across the product life cycle. For analyses focused solely on CO2 or total GHG emissions, carbon footprint (CF) methods offer a simpler, faster alternative requiring fewer data and less expertise.
Research framework
The study reviews tools for assessing resource efficiency and, recognizing that proper tool selection is difficult for smallholders. It therefore establishes criteria ─ based on data needs, ease of use, analysis, interpretation, and practical recommendations ─ and identities tools suitable for small-scale producers.
Findings show that lean tools often require expert interpretation, while REVAM is more accessible. When environmental assessment is needed, simplified LCA can be used, though CF remains the most practical option for smallholders.
The resulting framework supports small producers in evaluating Scopes 1-3 emissions and improving resource management. By combining purpose-driven tools like REVAM and CF with established models such as GHG Protocol, Carbon Disclosure Project (CDP), and Partnership for Carbon Accounting Financials (PCAF), businesses can better identify inefficiencies and emission sources.
Material and Methods
This study proposes and integrated resource-management approach for small-scale aquaculture by combining the Resource Value Mapping (REVAM) method with CF analysis to simultaneously assess resource-use efficiency and environmental impacts. REVAM follows five steps:
(1) Defining goals and systems boundaries;
(2) Mapping the site to visualize processes;
(3) Collecting data on resources, assets, and processes;
(4) Classifying activities as value-added (VA), non-value added (NVA), or waste (W); and
(5) Generating a “Process Box” that displays resource contributions and highlights inefficiencies.
Carbon footprints are calculated using emission factors (EFs) from IPCC or national databases, converting activity data into CO2-equivalent emissions. Because REVAM´s step- 3 data mirror CF activity data, both methods are merged into a unified Process Box that presents resource use, machine vs. non-machine inputs, and GHG emissions.
The proposed REVAM model adapts lean classifications to the agricultural context, allowing smallholders to distinguish between machinery and non-machinery activities.
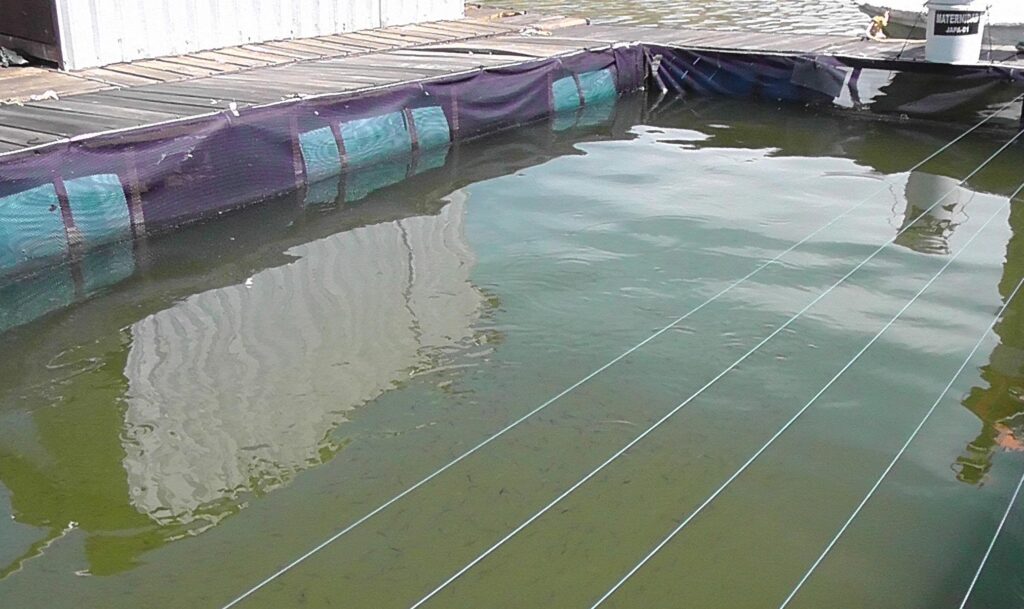
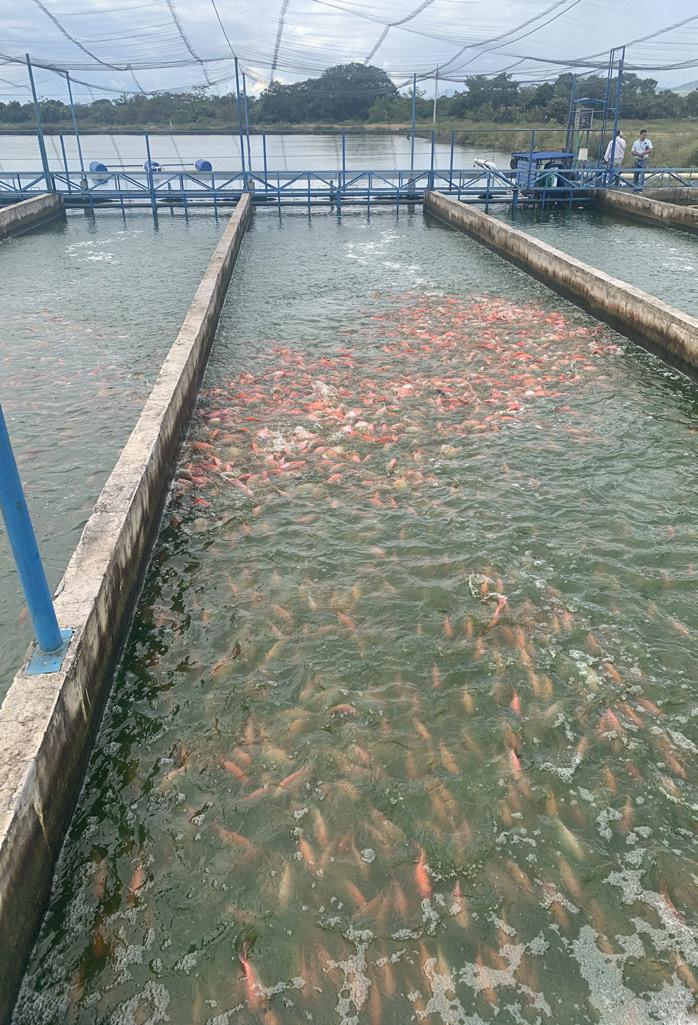
A case study was conducted on a Thai Nile tilapia farm comparing a conventional pond system and an In-Pond Raceway Systems (IPRS). The systems differ in water-quality control, feeding, circulation, and energy demand. Data from pond preparation through transportation were collected to evaluate resource flows, energy use, and emissions under both systems, focusing on the growout phase.
Results
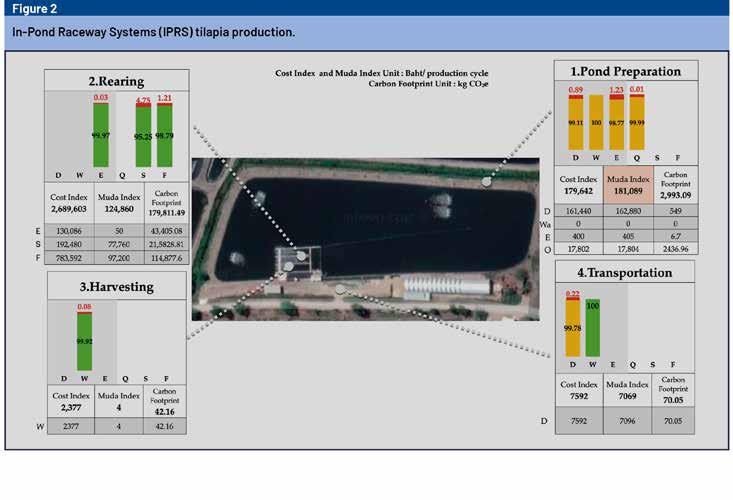
The data collected from both Nile tilapia production systems ─ the conventional pond system and the IPRS ─ were analyzed using the established indicators. Results are presented in Figures 1 and 2.
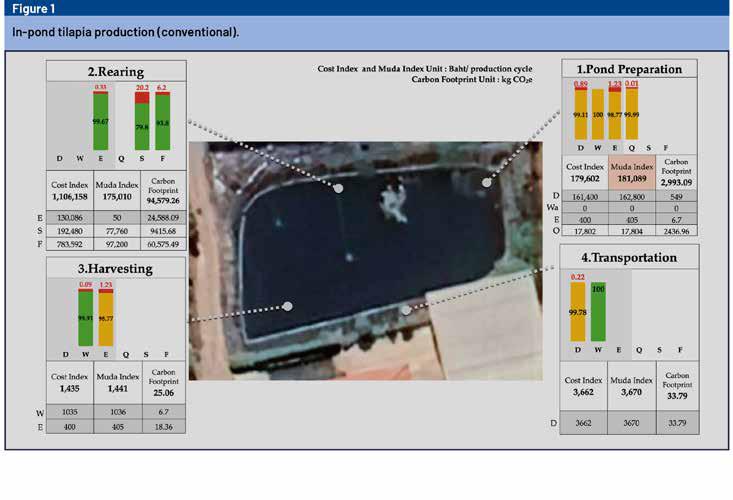
Overall, pond preparation emerged as the most resource-intensive and critical process in both systems. This stage showed identical Consumption Intensity (CI) and Muda Index (MI) values for ponds and IPRS. Pond excavation dominated MI contributions at 89.95%, followed by quicklime application for pond conditioning at 9.83%, and electricity for water pumping at 0.22%.
Value-added (VA) processes
Feeding, water-quality management, and harvesting — processes directly linked to fish growth and customer requirements — were classified as value-added (VA) activities in both systems. They had lower MI values than pond preparation, yet represented the highest resource costs.
In the pond system, resource costs during rearing were primarily attributed to:
» Fish feed (60.70%).
» Fingerlings (14.19%).
» Electricity for aeration (10.08%).
Pond preparation costs included:
» Diesel for excavation (12.51%).
» Quicklime (1.38%).
» Electricity for pumping (0.03%).
Transportation accounted for 0.28% with no additional water cost because pond water was used directly. In the IPRS, productivity was three times higher than in the pond system, leading to proportionally greater resource use. Major rearing costs were:
» Fish feed (53.47%).
» Fingerlings (32.01%).
» Electricity for water circulation and sludge removal (7.93%).
Pond preparation remained the second most expensive process, with costs allocated to diesel (5.61%), quicklime (0.62%), and pumping electricity (0.01%). Transportation diesel contributed 0.26%. Harvesting in both systems used minimal tap water (0.08%) and required negligible additional energy.
Non-value-added (NVA) and waste (W) activities
Activities such as water draining (pond system), fish rinsing, trimming, and general transportation were classified as non-value-added (NVA) unless live fish were specifically required by customers — in which case water used for fish transport became value-added. Their low MI values meant that inefficiencies in these tasks had minimal impact on overall resource intensity.
Greenhouse gas emissions
GHG emissions showed that rearing was the dominant source of CO₂equivalent impacts in both production systems.
For the pond system:
» Total emissions: 97,640.74 kg CO₂e.
» Feeding: 60,575.49 kg CO₂e.
» Pond preparation: 2993.09 kg CO₂e.
» Transportation: 33.79 kg CO₂e.
» Harvesting: 25.06 kg CO₂e.
For the IPRS:
» Total emissions: 182,916.80 kg CO₂e.
» Feeding: 114,877.60 kg CO₂e.
» Pond preparation: 2993.09 kg CO₂e (unchanged from pond system).
» Transportation: 70.05 kg CO₂e.
» Harvesting: 42.16 kg CO₂e.
Higher emissions in the IPRS were driven by greater feed use and electricity demand associated with continuous water circulation.
Improvement strategy
MI analysis revealed that pond excavation was the activity with the highest machine-related MI due to engine start-up losses, idling, and delays. Recommended improvements include:
» Shutting down machinery during idle periods.
» Minimizing mechanical losses.
» Using more fuel-efficient engines or biomass-based fuels.
Non-machine resource loss was tied mainly to excessive quicklime use. Recommended measures include precise measuring tools and improved handling practices to prevent over-application.
The carbon footprint assessment highlighted fish feed as the largest contributor to GHG emissions in both systems. Strategies to mitigate environmental impact include:
» Optimizing feeding patterns (e.g., swing-feeding methods).
» Utilizing IPRS’s controlled feeding environment to reduce excess feed.
» Reformulating feed by replacing fishmeal or fish oil with lower-impact alternatives such as soybean meal, poultry byproduct meal, or fish trimmings.
Additionally, quicklime — responsible for both high MI and CO₂ contributions — can be partially replaced with finely ground eggshells, which offer similar pH adjustment benefits with a lower carbon footprint.
Finally, improvements were aligned with the scopes of the GHG
Protocol:
» Scope 1: Reduce fuel use via biofuels and machine shutdowns.
» Scope 2: Lower electricity demand through operational efficiency.
» Scope 3: Mitigate impacts through improved feed practices, alternative raw materials, and adoption of closed-system technologies such as the IPRS.
These strategies collectively enhance resource-use efficiency and reduce emissions across the aquaculture production cycle.
Discussion
This study introduces a framework focusing on resource efficiency and environmental impact for small- scale producers by proposing a combined REVAM and carbon footprint method. The objective was to provide a method for conducting a comprehensive assessment of resource utilization efficiency and environmental impact within the agricultural sector to allow small-scale producers to identify critical areas that utilize resources without generating value, facilitating the identification of areas with significant GHG emissions, leading to improvements in resource utilization and a reduction in GHG emissions.
The results from both the pond system and IPRS indicate that the rearing process, particularly fish feed (F), exhibited the highest waste ratios, at 20.20% and 4.75%, respectively, surpassing all other processes and resources. Despite not holding the highest MI value, the rearing process demonstrated a notable waste ratio. Therefore, REVAM not only guides improvements in areas with high MI values but also identifies waste in other areas, contributing to an overall improvement in resource use efficiency.
The application of REVAM in tandem with a carbon footprint analysis for waste reduction, resource optimization, and GHG emission minimization within diverse agricultural activities, underscores the significance of contextual factors in waste and loss generation for activity classification.
Natural environmental variables, such as mortality rates, waiting times, and uncontrollable excess yields, substantially impact agricultural and aquacultural processes. By consolidating non-machine resource usage into the results presented within the process box, a comprehensive analysis of resources can be conducted, and the origins of waste can be specifically clarified.
The rearing process, driven by the high EF value of the fish feed used, contributed the most to GHG emissions. Consistent with LCA studies on tilapia farming, feed emerged as a major environmental impact factor. Emissions are not solely dependent on the amount; the type of resource used is equally crucial. Different resources or processes for the same product yield can have different environmental impacts.
The recommendations for enhancing resource use include setting operational guidelines for resource control, improving feeding efficiency (e.g., feeding control in bucket cages), exploring alternative resources (e.g., eggshells instead of quicklime and adjusted fish feed formulas), and transitioning to closed-system aquaculture to reduce environmental impacts. Moreover, the case study involved tilapia production in both ponds and the IPRS innovation.
The findings revealed that the IPRS exhibited a lower cost for each ton of fish than the traditional pond system, owing to the generation of a higher annual income due to a threefold increase in production and the maintenance of an average fish weight of 1 kg, resulting in an enhanced selling price. However, the system had a higher installation cost, leading to extended payback and investment periods. Nonetheless, it offered opportunities to enhance product quality and production capacity for foreign markets.
Conclusion
Conclude that lined ponds exhibit greater water use efficiency, a lower carbon footprint, and higher sustainable production density. This study presents a practical strategy for reducing GHG emissions by integrating REVAM with carbon footprint assessment, enabling smallholders to identify waste, improve resource use, and meet environmental expectations. By adapting industrial waste-identification methods to agriculture and applying them to IPRS aquaculture, the model supports informed technology adoption and standardized production. Although based on a single location and limited cost scope, the approach offers a valuable guideline for small producers and a foundation for future research incorporating labor and additional efficiency indicators.

This informative version of the original article is sponsored by: REEF INDUSTRIES INC.
This is a summarized version developed by the editorial team of Aquaculture Magazine based on the review article titled “RESOURCE EFFICIENCY AND ENVIRONMENTAL IMPACT ASSESSMENT METHOD FOR SMALL-SCALE PRODUCERS: A CASE STUDY OF POND AND IN-POND RACEWAY SYSTEM PRODUCTION FOR GROWING NILE TILAPIA”. The original article, including tables and figures, was published on FEBRUARY,2024, through SUSTAINABILITY. The full version can be accessed online through this link: https://doi.org/10.3390/su16031237