


Shrimps are one of the fastest-growing commodities in aquaculture and have a considerable land footprint. Their production exists on a continuum from “extensive” to “intensive”. Here is an exploration of the impact of utilizing different production methods: extensive vs intensive for expanding shrimp production on the cumulative land footprint of shrimp aquaculture through a meta-analytic approach that modeled different scenarios of production expansion.
Food production accounts for a substantial portion of humankind’s land footprint. Studies showed that land use is a point of contention in aquaculture and environmental concern because of the impact shrimp and fish culture have had on the coastal areas in South-east Asia and Latin America.
“A recent estimate by Boyd and McNevin (2018) revealed that there are approximately 2.3 million hectares of shrimp ponds globally.”
Aquaculture production exists on a continuum from “extensive” to “intensive”. These systems rely on natural productivity and have limited to no feed use. Systems can be described as intensive when the production relies on formulated feeds and aeration to increase production intensity (i.e., the amount produced per a given area).
In terms of resource use, extensive systems are often thought to use fewer resources than intensive production due to the low input nature of the production methods. However, there is a great disparity between the land footprint of extensive systems and intensive systems and their output in terms of production.
There are several factors beyond the production intensity that determine how land-intensive shrimp farms are. Shrimp farms require more land than just the ponds, and this is a function of pond size to some extent. Altogether, the land used at the farm for shrimp farming is considered “direct” land use.
“In intensive systems where pelleted feeds are used, the land footprint also includes embodied land, which is the land accounted for during the production of ingredients in the feed.”
Here is presented a summary of a research that explores different land use scenarios to understand the impact of production systems on land use in shrimp, and to utilize data in the published literature from major and minor shrimp producing countries.
Methods
Data collection
A systemic search was performed to collect published studies related to resource use in shrimp aquaculture. An information science professional was consulted in constructing the search terms for the database queries. A special criterion was set up to include the investigations, and three unpublished datasets were included in addition to sources identified during the systematic review.
The Aquaculture Stewardship Council’s farm audits were scraped for the variables of interest to generate a dataset. A dataset including farms in Vietnam, Ecuador, and India using surveys similar to Boyd et al. (2018) collected in 2019–2020 by the World Wildlife Fund and a dataset from Indonesia collected by the Moore Foundation in 2017 was included.
Land use scenarios
Land use was considered at three production levels. The first level would be the 2016 totals consistent with the global production of farm shrimp (Boyd and McNevin, 2018), which is about 4.875 million metric tons. Additionally, two future production levels, 7.5 million t, and 10 million t were considered.
Four scenarios were considered at each production threshold. For all scenarios, the production intensity from extensive systems was assumed to be the same as calculated in Boyd and McNevin (2018), 0.667 t/ha. First, a business-as-usual (BAU) projection was constructed (Scenario I).
Here, the ratio of production between extensive and intensive production was maintained (about 87% intensive and 13% extensive), and the production intensity of intensive production was maintained at the same level as presented in Boyd and McNevin (2018).
“The total land use/metric ton was ascertained using model 1. and embodied land was calculated using model 2 (Boyd and McNevin, 2018).”
The farm area was considered the product of the result of model 1 and model 2 and the embodied land was considered to be the difference between the resulting product and the result of model 1. The next scenario (Scenario II) utilized only extensive production to expand production totals.
The same amount of intensive production in the baseline scenario was maintained and the difference in production was met with extensive production. Thus, extensive land was increased to meet production goals.
This scenario is not as likely as the BAU scenario or scenarios that follow but demonstrates well the impact of increasing the use of extensive production for meeting future demand in shrimp production.

Scenario III estimated land use with the expansion in production with intensive production only, but at the same production intensity as the baseline scenario. This scenario was meant explore to the increase in the land while maintaining current industry practices while limiting the expansion of extensive production.
The final scenario (Scenario IV) examined land use under a scenario where farmland for shrimp farms was not increased. The extensive production, and therefore land totals, was maintained at the baseline levels, and the farm area for shrimp ponds was not increased from the estimate in the baseline scenario.
Model 1 was then used to calculate the total land footprint and the embodied land was considered the difference. Once total land burdens were calculated, the net difference between each of the three scenarios and business-as-usual projections were calculated.
Results
The total number of records screened by title and abstract was 1682, of which 62 were accessed via full text. There were 29 records assessed via full text that was found to be suitable for inclusion in this study. A summary table of the studies included in this analysis is presented in Table 1.

In total, 973 farms that were split into 22 datasets were included in this study representing 7 countries ranging in years from 2007 to 2020. The summary data for select farm characteristics can be seen in Table 2.

The largest farms were found in the Americas, with the average farm size in Ecuador being 300 ha and the average farm size in Honduras being 1156 ha. The smallest farms were in China. The mean production intensities observed in the data varied greatly, however lowest values for vannamei were in Ecuador and Honduras, while Indian monodon had the lowest value overall.
The meta-analytic regressions, referred to as the ‘global models’, resulting from the meta-analysis are presented in Table 3.
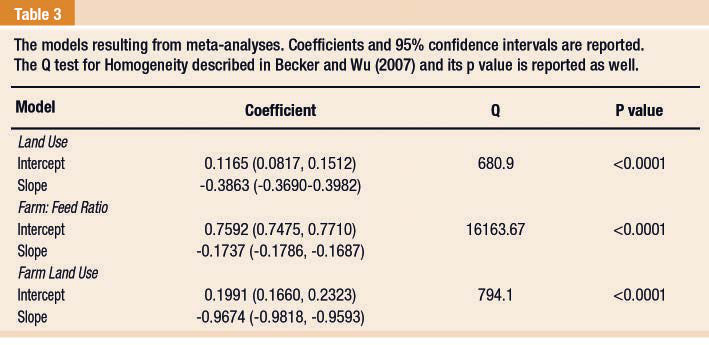
Model one is on an ln-ln scale, which leads to an easy understanding of the slope. In this case, a 10% increase in production intensity will decrease the total land burden by 3.8%. The relationship between land use and production intensity is modeled in Figure 1.
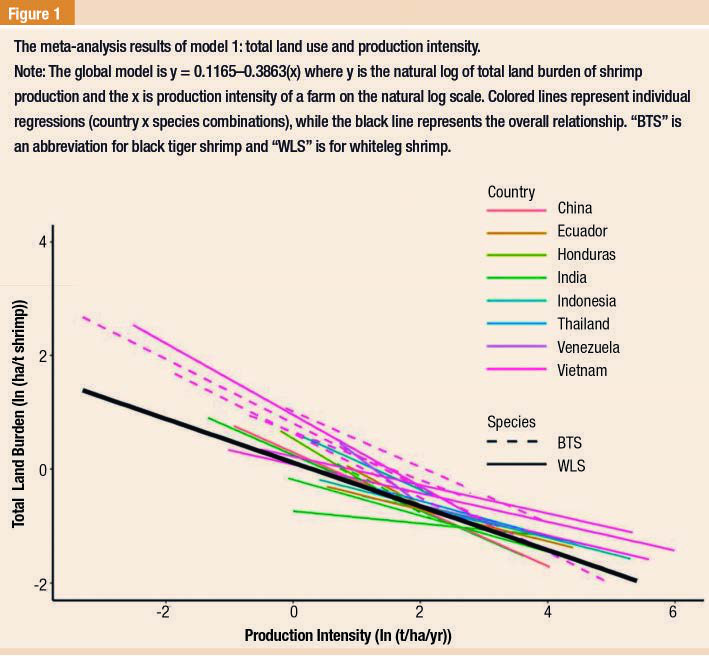
Model 2 shows that there is a decrease in land burden at the farm site proportionally as the production intensity increases. In each case, the Q statistic for heterogeneity was significant, which suggests there is variation across studies as well as within studies. Model 3 was used to calibrate the average production intensities needed to obtain production targets in Scenario IV of future land use.
The current land use (embodied and direct) in shrimp aquaculture was estimated with the models generated herein to be about 3.9 million ha. The results of scenarios to meet future production demands are found in Table 4.

The business as usual (BAU) scenario (scenario I) resulted in a ~2.1 million ha increase in land footprint when the production increased to 7.5 million t, and ~4.0 million ha when production is increased to 10 million t.
The extensive production (Scenario II) resulted in net increases in land use (~1.9 and 3.7 million ha, respectively) when compared to the BAU scenario, and intensive expansions resulted in net land savings in both the “intensive only” and “no farm expansion” scenario (Scenario III and Scenario IV, respectively) (Figure 2).
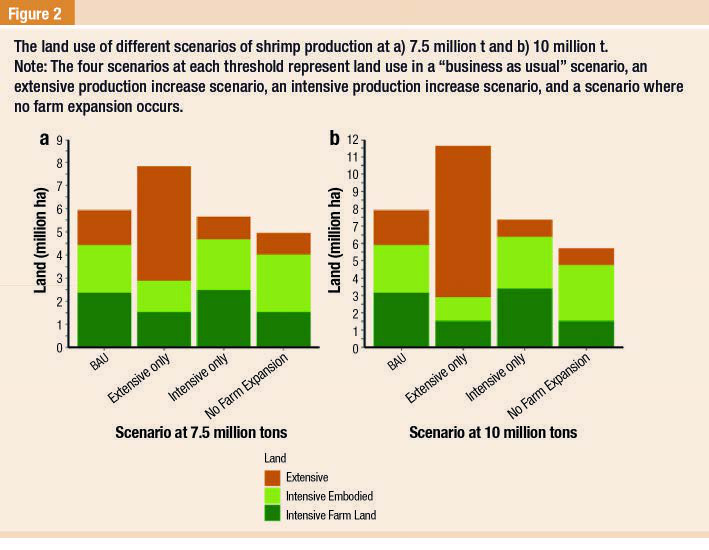
In the “no farm expansion” scenario (Scenario IV), production intensities increased from 3.67 t/ha
pond area as the baseline to 5.76 t/ha pond area at 7.5 million t and 7.94 t/ha pond area at 10 million t of production.
Discussion
The model results from the meta-analysis showed that on average, total land use decreases by 3.8% for every 10% increase in production intensity. This is the first attempt to report land burdens in this fashion.
The assessment of land use favors the expansion or intensification of intensive aquaculture operations in terms of saving land, which could be subsequently conserved.
The production intensities reached in the “no farm conversion” scenario (Scenario IV), 5.76 and 7.94 t/ha pond area for 7.5 million metric tons of production and 10 million metric tons respectively, are not unreasonably high levels such that they are unattainable by farmers in a practical sense.
“Additionally, these values represent the average intensity to meet these targets, and therefore not all farmers would need to operate at these levels, as many are likely technically or practically limited below these thresholds.”
The average value estimates serve as an attempt to calculate land use, not a definitive value. However, because feed companies are not willing to share their feed formulations for traceability and resource use assessments, an industry-wide average based on published diets is the closest approximation available.
In all scenarios present, no conversion of extensive to intensive farms is considered. Reducing the
area of extensive farms would, at current levels, have a great impact on land conversion in shrimp aquaculture. The issue of land use is extensively studied in protein production.

On a per-ton basis, the average land use for shrimp estimated in this study (calculated from the data presented in Table 4) ranged from 0.57 to 1.16 ha/t, based on the various scenarios presented. The land use for intensive shrimp farms in the various scenarios was less than the overall averages in the scenarios and ranged from 0.51 to 0.68 t/ha.
While this study was limited farms that operate processing plants within the grounds, especially in Latin America. Hatcheries and processing facilities often have relatively small land footprints compared to ponds, and it would likely be relatively inconsequential to the analysis of this study.
“The results here support land sparing, especially if the goal is to protect high-value areas like mangroves and coastal land, which will be important in both stymieing the impacts of climate change.”
Land use is a result of government policy, especially in mangroves, and therefore any changes to current patterns in land sparing and land sharing are likely going to result in shifts from governmental focus and not individual shrimp farmers changing practices.
The move towards a more intensive shrimp production supply chain would allow for flexibility in retailers and producers that are aiming to improve their “sustainability”. When a majority of the land footprint is in the feed ingredients as is the case in intensive production, buyers could actively choose where their land footprint is.
“Almost the entire land footprint of extensive farming is in the coastal area, and therefore mitigation is not possible or feasible without ceasing operations in those areas, which is less flexible.”
Additionally, future growth in shrimp aquaculture could come at the expense of mangrove areas in places like Africa where there is relatively little aquaculture, but growth is expected. This study shows that minimizing the expansion of extensive production could mitigate losses to mangroves in those areas.
Conclusions
In conclusion, the results of this assessment of land use utilizing meta-analysis demonstrate that land use at set production targets is decreased by increasing production intensity, and the land footprint of shrimp farming is displaced from the farms to the embodied land used captured in feed ingredients to produce the feeds as production intensity increases.
This study only examined shrimp aquaculture; however, the principles of this study could be applied to any species grown under what would be described as intensive conditions, especially in ponds where the culture system is similar to shrimp, and enough data likely exists in the published literature to compare across species in this framework (e.g., tilapia or catfish).
This is a summarized version developed by the editorial team of Aquaculture Magazine based on the review article titled “EXPLORING THE RELATIONSHIP BETWEEN PRODUCTION INTENSITY AND LAND USE: A METAANALYTIC APPROACH WITH SHRIMP AQUACULTURE” developed by ROBERT DAVIS – Auburn University, School of Fisheries, Aquaculture, and Aquatic Sciences, USA; ASH ABEBE – Auburn University, Department of Mathematics and Statistics, USA; CLAUDE BOYD – Auburn University, School of Fisheries, Aquaculture, and Aquatic Sciences, USA; AARON MCNEVIN- The World Wildlife Fund, District of Columbia, USA.
The original article was published in Elsevier Journal of Environmental Management in September 2021.
The full version can be accessed freely online through this link: https://doi.org/10.1016/j.jenvman.2021.113719